LECTURE 1
Learning objectives – why and what to study in statistics
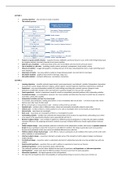
The research process –
Features of good scientific theories – supported by data; falsifiable; parsimony (Occam’s razor: all the other things being equal,
the simplest solution is the best); theories do not prove anything
Daily life uses of statistics – understand what events were truly unlikely and what events were just chance
Use of statistics in a job view – marketing; quality control; personnel; management; stock market; science
Misuses of statistics – exaggerated graphics; revealing only part of the data; using hypothesis tests to make something sound
more important
Importance of clarity – too many patterns; patterns change between graphs; too much data for one figure
Descriptive statistics – graphical and numerical (average, range, etc.)
Inferential statistics – testing for differences, correlations, interactions
LECTURE 2
Learning objectives – scientific methods (experimental, quasi-experimental, correlational); variables (independent, dependent,
measurement scales); designs (between-subjects, within-subjects, matched-subjects); hypothesis (experimental, statistical)
Experiment – vary some independent variable (IV) while holding everything else constant; measure changes in some
dependent variable (DV); changes in DV must have been caused by changes in IV (we can infer causality)
Quasi-experiment – similar to experiment except IB cannot be manipulated; potential problems with confounding variables
Correlational design – no manipulation; measure 2 (or more) variables and determine the extent to which they are related to
each other; cannot infer causality
Independent variables can have 2 or more levels
For example, test participants’ reading speed before a meal, immediately after and 2h after – 1 IV (time of day) with 3 levels
(before meal, after meal, 2h after meal)
DV has several types or measurement scales – nominal, ordinal, interval, and ratio
Nominal scale – numbers refer to different classes; classes not necessarily numerically related to each other
Ordinal scale – numbers indicate a relative position in a list; rank is meaningful, items not necessarily at equal intervals
Interval scale – equal steps are meaningful
Ratio scale – equal steps are meaningful and there is a meaningful zero point
Confounding variable – variable that confounds the interpretation of the results of an experiment; confounding occurs when
some aspect of the experimental situation varies systematically with the IV
Between-subjects design – each condition is applied to a different group of participants; it is often the only option available;
individual differences (by assigning participants randomly to groups, individual differences should roughly balance between
groups)
Within-subjects design – same participant performs at all levels of the independent variable; also known as repeated measures
design because participants repeat the measure for each different condition; this design is generally much more powerful
because each participant is their own control so individual differences are ruled out
Withing-subjects design disadvantages – order effects; if all your participants do all conditions then make sure the order varies
either randomly or counterbalanced
Matched-subjects design – researchers attempt to emulate some of the strengths of within subjects designs and between
subjects designs
Correlational design – researcher seeks to understand what kind of relationships naturally occurring variables have with one
another
Experimental hypothesis – questions that we wish to address in experiments, based on our theories
Statistical hypothesis – precise statements about collected data
The statistical hypothesis can be further divided into two types of hypothesis: null hypothesis and alternate hypothesis
Null hypothesis – simple states that the different samples we look at come from the same population
Alternative hypothesis – the logical opposite of the null hypothesis
We reject the null hypothesis when the probability of null hypothesis being true (p) is less than some criterion (α)
, Usually we set α=0.05 (i.e. a 1 in 20 chance)
if p<0.05, we mean there was less than a 1 in 20 probability of it happening by chance
To determine p, we calculate a test statistic
The test statistic has known probabilities associated with its values
p is the probability of collecting this data assuming the Null Hypothesis to be true
i.e. the probability that the effect we measured is simply due to chance
α (alpha) is the criterion level that we set: p has to be less than α for us to think the events we have measured are unusual.
if p > α we have: “failed to reject the Null Hypothesis”
this does not mean that it is true: just that we have not got any real reason to reject it (yet).
LECTURE 3
Learning objectives – how we represent data in terms of frequency; the different measures of central tendencies; how we
represent data in terms of spread
Categorical data – has two or more categories with no ordering to them; for example, hair colour, job title
Discrete data (usually ordinal, ratio, or interval variables) – has fixed value with a logical order; for example, shoe size, score
out of 10
Continuous data – can take any fractional value; for example, reaction times
Categorical data – can be presented as its raw frequency or as a percentage frequency
Measures of central tendency – sometimes we want to condense the entire frequency distribution to a single number; this is
where we might calculate the central tendency of the data
Mode – the score occurring most often in a dataset; most common score; can be used for nominal data; sometimes takes more
than one value (bimodal and multimodal distributions)
Median – the middle score in a dataset; the middle value in a dataset, or the mean of the middle two values; pros of median is
that its insensitive to outliers, often gives a real and meaningful data value, and useful for ordinal and skewed interval/ration
data; cons of median are ignores a lot of the data, difficult to calculate without a computer, and cannot use this with nominal
data
Mean – sum of data points/number of data points; pros of mean are using all of the data and is most effective for normally
distributed datasets; cons of mean is that its sensitive to outliers, values are not always meaningful, and only meaningful for
ratio and interval data
Mode – no measures of spread
Median – ‘distance-based’ measures such as range and interquartile range
Mean – ‘centre-based’ measures of spread such as variance and standard deviation
Interquartile range – similar to range (highest score – lowest score) but ignores most extreme values; pros and cons are
identical to median
Standard deviation is square root of variance
Variance – pros are using all of the data and forms the basis of several other tests; cons are it requires a normal distribution,
sensitive to outliers, and units are not sensible
Standard deviation – a measure of spread that is equal to the unit of measurement of the dependent variable; can measure
standard deviation of sample, population, or estimated standard deviation of a population based on a sample; allows us to get
an unbiased estimate of the population’s standard deviation if we only have access to a sample of data
Sometimes you might want to use a frequency distributions and histograms to represent your data.
Sometimes it is easier to use measures of central tendency and spread instead:
Categorical data- use mode
Ordinal data- use median and interquartile range
Continuous data- use mean and standard deviation
LECTURE 4
Learning objectives – what normal distribution is, and how this is associated with skew and standard deviations; how to
transform data using z scores; what sampling error is, how we might calculate it
Normal distribution – when data is symmetrical around central scores; for example, flip a coin 20 times, repeat this thousands
of times; data should fit around a Gaussian curve
Gaussian curve –
Learning objectives – why and what to study in statistics
The research process –
Features of good scientific theories – supported by data; falsifiable; parsimony (Occam’s razor: all the other things being equal,
the simplest solution is the best); theories do not prove anything
Daily life uses of statistics – understand what events were truly unlikely and what events were just chance
Use of statistics in a job view – marketing; quality control; personnel; management; stock market; science
Misuses of statistics – exaggerated graphics; revealing only part of the data; using hypothesis tests to make something sound
more important
Importance of clarity – too many patterns; patterns change between graphs; too much data for one figure
Descriptive statistics – graphical and numerical (average, range, etc.)
Inferential statistics – testing for differences, correlations, interactions
LECTURE 2
Learning objectives – scientific methods (experimental, quasi-experimental, correlational); variables (independent, dependent,
measurement scales); designs (between-subjects, within-subjects, matched-subjects); hypothesis (experimental, statistical)
Experiment – vary some independent variable (IV) while holding everything else constant; measure changes in some
dependent variable (DV); changes in DV must have been caused by changes in IV (we can infer causality)
Quasi-experiment – similar to experiment except IB cannot be manipulated; potential problems with confounding variables
Correlational design – no manipulation; measure 2 (or more) variables and determine the extent to which they are related to
each other; cannot infer causality
Independent variables can have 2 or more levels
For example, test participants’ reading speed before a meal, immediately after and 2h after – 1 IV (time of day) with 3 levels
(before meal, after meal, 2h after meal)
DV has several types or measurement scales – nominal, ordinal, interval, and ratio
Nominal scale – numbers refer to different classes; classes not necessarily numerically related to each other
Ordinal scale – numbers indicate a relative position in a list; rank is meaningful, items not necessarily at equal intervals
Interval scale – equal steps are meaningful
Ratio scale – equal steps are meaningful and there is a meaningful zero point
Confounding variable – variable that confounds the interpretation of the results of an experiment; confounding occurs when
some aspect of the experimental situation varies systematically with the IV
Between-subjects design – each condition is applied to a different group of participants; it is often the only option available;
individual differences (by assigning participants randomly to groups, individual differences should roughly balance between
groups)
Within-subjects design – same participant performs at all levels of the independent variable; also known as repeated measures
design because participants repeat the measure for each different condition; this design is generally much more powerful
because each participant is their own control so individual differences are ruled out
Withing-subjects design disadvantages – order effects; if all your participants do all conditions then make sure the order varies
either randomly or counterbalanced
Matched-subjects design – researchers attempt to emulate some of the strengths of within subjects designs and between
subjects designs
Correlational design – researcher seeks to understand what kind of relationships naturally occurring variables have with one
another
Experimental hypothesis – questions that we wish to address in experiments, based on our theories
Statistical hypothesis – precise statements about collected data
The statistical hypothesis can be further divided into two types of hypothesis: null hypothesis and alternate hypothesis
Null hypothesis – simple states that the different samples we look at come from the same population
Alternative hypothesis – the logical opposite of the null hypothesis
We reject the null hypothesis when the probability of null hypothesis being true (p) is less than some criterion (α)
, Usually we set α=0.05 (i.e. a 1 in 20 chance)
if p<0.05, we mean there was less than a 1 in 20 probability of it happening by chance
To determine p, we calculate a test statistic
The test statistic has known probabilities associated with its values
p is the probability of collecting this data assuming the Null Hypothesis to be true
i.e. the probability that the effect we measured is simply due to chance
α (alpha) is the criterion level that we set: p has to be less than α for us to think the events we have measured are unusual.
if p > α we have: “failed to reject the Null Hypothesis”
this does not mean that it is true: just that we have not got any real reason to reject it (yet).
LECTURE 3
Learning objectives – how we represent data in terms of frequency; the different measures of central tendencies; how we
represent data in terms of spread
Categorical data – has two or more categories with no ordering to them; for example, hair colour, job title
Discrete data (usually ordinal, ratio, or interval variables) – has fixed value with a logical order; for example, shoe size, score
out of 10
Continuous data – can take any fractional value; for example, reaction times
Categorical data – can be presented as its raw frequency or as a percentage frequency
Measures of central tendency – sometimes we want to condense the entire frequency distribution to a single number; this is
where we might calculate the central tendency of the data
Mode – the score occurring most often in a dataset; most common score; can be used for nominal data; sometimes takes more
than one value (bimodal and multimodal distributions)
Median – the middle score in a dataset; the middle value in a dataset, or the mean of the middle two values; pros of median is
that its insensitive to outliers, often gives a real and meaningful data value, and useful for ordinal and skewed interval/ration
data; cons of median are ignores a lot of the data, difficult to calculate without a computer, and cannot use this with nominal
data
Mean – sum of data points/number of data points; pros of mean are using all of the data and is most effective for normally
distributed datasets; cons of mean is that its sensitive to outliers, values are not always meaningful, and only meaningful for
ratio and interval data
Mode – no measures of spread
Median – ‘distance-based’ measures such as range and interquartile range
Mean – ‘centre-based’ measures of spread such as variance and standard deviation
Interquartile range – similar to range (highest score – lowest score) but ignores most extreme values; pros and cons are
identical to median
Standard deviation is square root of variance
Variance – pros are using all of the data and forms the basis of several other tests; cons are it requires a normal distribution,
sensitive to outliers, and units are not sensible
Standard deviation – a measure of spread that is equal to the unit of measurement of the dependent variable; can measure
standard deviation of sample, population, or estimated standard deviation of a population based on a sample; allows us to get
an unbiased estimate of the population’s standard deviation if we only have access to a sample of data
Sometimes you might want to use a frequency distributions and histograms to represent your data.
Sometimes it is easier to use measures of central tendency and spread instead:
Categorical data- use mode
Ordinal data- use median and interquartile range
Continuous data- use mean and standard deviation
LECTURE 4
Learning objectives – what normal distribution is, and how this is associated with skew and standard deviations; how to
transform data using z scores; what sampling error is, how we might calculate it
Normal distribution – when data is symmetrical around central scores; for example, flip a coin 20 times, repeat this thousands
of times; data should fit around a Gaussian curve
Gaussian curve –