FACULTY OF ECONOMIC AND FINANCIAL SCIENCE
DEPARTMENT OF COMMERCIAL ACCOUNTING
BFB33B3 / CFM22A2 / CFM2AA2
REVISION GUIDE SOLUTIONS
SEMESTER
, BFB33B3/CFM22A2/CFM2AA2: REVISION SOLUTIONS
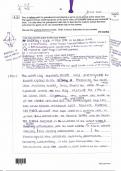
1. FINANCIAL STATEMENT ANALYSIS
Investment ratios
20.2 20.1
EPS R 128.00 R 237.00
500 500
R 0.26 R 0.47
P/E R 2.80 R 3.75
R 0.26 R 0.47
10.77 times 7.98 times
DIVIDENDS PER SHARE R 53.00 R 99.00
500 500
R 0.11 per share R0.20 per share
DIVIDEND COVERAGE R 128.00 R 237.00
R 53.00 R 99.00
2.42 times 2.39 times
DIVIDEND PAYOUT R 53.00 R 99.00
R 128.00 R 237.00
0.41 times 0.42 times
41% 42%
MRKT PRICE TO BV R 1 400.00 R 1 875.00
R 915.00 R 840.00
1.53 times 2.23 times
, BFB33B3/CFM22A2/CFM2AA2: REVISION SOLUTIONS
WORKING CAPITAL RATIOS
STATEMENT OF FINANCIAL POSITION BALANCES
20.2 20.1 AVERAGES
Inventory R 65.00 R 60.00 R 62.50
Debtors R 122.00 R 108.00 R 115.00
Trade payables R 98.00 R 88.00 R 93.00
Purchases R 2 041.00
Note: Rations and averages have been calculate for 20.2. For 20.1 there are no opening values thus
averages cannot be calculated for the balance sheet numbers.
TURNOVER RATIOS TURNOVER TIME RATIOS
Assumption: 365 days in a year
Inventory R 2 036.00 AAI R 62.50
X 365
R 62.50 R 2 036.00
32.58 times 11.20 days
Debtors R 3 573.00 ACP R 115.00
X 365
R 115.00 R 3 573.00
31.07 times 11.75 days
Trade payables R 2 041.00 APP 93
X 365
R 93.00 2041
21.95 times 16.63 days
Multiple choice answers
CPR cash inflow in March: C - R119 000
Cash receipts in July: A – R220
Firms total cash receipts in November: D – Cannot be determined with the information
provided
Closing cash balance C – R2 500
Page 3 of 25
DEPARTMENT OF COMMERCIAL ACCOUNTING
BFB33B3 / CFM22A2 / CFM2AA2
REVISION GUIDE SOLUTIONS
SEMESTER
, BFB33B3/CFM22A2/CFM2AA2: REVISION SOLUTIONS
1. FINANCIAL STATEMENT ANALYSIS
Investment ratios
20.2 20.1
EPS R 128.00 R 237.00
500 500
R 0.26 R 0.47
P/E R 2.80 R 3.75
R 0.26 R 0.47
10.77 times 7.98 times
DIVIDENDS PER SHARE R 53.00 R 99.00
500 500
R 0.11 per share R0.20 per share
DIVIDEND COVERAGE R 128.00 R 237.00
R 53.00 R 99.00
2.42 times 2.39 times
DIVIDEND PAYOUT R 53.00 R 99.00
R 128.00 R 237.00
0.41 times 0.42 times
41% 42%
MRKT PRICE TO BV R 1 400.00 R 1 875.00
R 915.00 R 840.00
1.53 times 2.23 times
, BFB33B3/CFM22A2/CFM2AA2: REVISION SOLUTIONS
WORKING CAPITAL RATIOS
STATEMENT OF FINANCIAL POSITION BALANCES
20.2 20.1 AVERAGES
Inventory R 65.00 R 60.00 R 62.50
Debtors R 122.00 R 108.00 R 115.00
Trade payables R 98.00 R 88.00 R 93.00
Purchases R 2 041.00
Note: Rations and averages have been calculate for 20.2. For 20.1 there are no opening values thus
averages cannot be calculated for the balance sheet numbers.
TURNOVER RATIOS TURNOVER TIME RATIOS
Assumption: 365 days in a year
Inventory R 2 036.00 AAI R 62.50
X 365
R 62.50 R 2 036.00
32.58 times 11.20 days
Debtors R 3 573.00 ACP R 115.00
X 365
R 115.00 R 3 573.00
31.07 times 11.75 days
Trade payables R 2 041.00 APP 93
X 365
R 93.00 2041
21.95 times 16.63 days
Multiple choice answers
CPR cash inflow in March: C - R119 000
Cash receipts in July: A – R220
Firms total cash receipts in November: D – Cannot be determined with the information
provided
Closing cash balance C – R2 500
Page 3 of 25