OE106 MARKETING
RESEARCH
Hogeschool InHolland Alkmaar
18-04-2022
Brian Blankert
649461
,Inhoudsopgave
Part A: Exploring the data [30 pts] ................................................................................................................... 2
Part B: Logistic regression [25 pts].................................................................................................................... 9
Part C. Linear regression [20 pts] .................................................................................................................... 12
Part D: Hierarchical cluster analysis [25 pts] ................................................................................................... 15
1
, Part A: Exploring the data [30 pts]
Answer the following questions with help of (statistical) hypothesis testing. (I.e. the questions
always pertain to the customers in general, not just to the sample you have.) State the null
hypothesis, the type of test, the statistical result of the test and the practical conclusion. [3
points per question.]
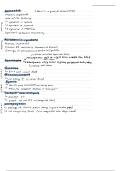
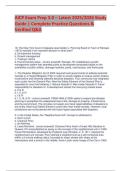
1. Do the customers who receive a newsletter generate a higher revenue than the
others, on average?
- H0= there is no link between receiving a newsletter and generating more revenue.
- HA = there is a link between receiving a newsletter and a higher yield from
customers
- For the test you should use the ‘Independent Samples T-Test’, because you must
compare two averages.
- Significance <0.001 which is lower than 0.05. You need the ‘one-sided p’ because
you only want to know if the revenue is higher when customers receive a
newsletter.
- H0 can be rejected and HA can be accepted. This means: Yes, customers who
receive a newsletter generate a higher revenue than others on average.
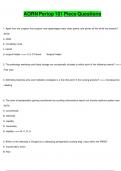
2. Is there a difference in average age depending on the size of the household a customer is
part of?
- H0 = there is no difference
between the average age
depending on the household.
- HA = there is a difference between
the average age depending on the
household.
- Oneway-Anova, because we have
to compare multiple groups.
- Significance 0.001 < 0.05, which
means there is a significant
difference. Yes, there is a
difference between de average age
and the sizes of the households.
2
RESEARCH
Hogeschool InHolland Alkmaar
18-04-2022
Brian Blankert
649461
,Inhoudsopgave
Part A: Exploring the data [30 pts] ................................................................................................................... 2
Part B: Logistic regression [25 pts].................................................................................................................... 9
Part C. Linear regression [20 pts] .................................................................................................................... 12
Part D: Hierarchical cluster analysis [25 pts] ................................................................................................... 15
1
, Part A: Exploring the data [30 pts]
Answer the following questions with help of (statistical) hypothesis testing. (I.e. the questions
always pertain to the customers in general, not just to the sample you have.) State the null
hypothesis, the type of test, the statistical result of the test and the practical conclusion. [3
points per question.]
1. Do the customers who receive a newsletter generate a higher revenue than the
others, on average?
- H0= there is no link between receiving a newsletter and generating more revenue.
- HA = there is a link between receiving a newsletter and a higher yield from
customers
- For the test you should use the ‘Independent Samples T-Test’, because you must
compare two averages.
- Significance <0.001 which is lower than 0.05. You need the ‘one-sided p’ because
you only want to know if the revenue is higher when customers receive a
newsletter.
- H0 can be rejected and HA can be accepted. This means: Yes, customers who
receive a newsletter generate a higher revenue than others on average.
2. Is there a difference in average age depending on the size of the household a customer is
part of?
- H0 = there is no difference
between the average age
depending on the household.
- HA = there is a difference between
the average age depending on the
household.
- Oneway-Anova, because we have
to compare multiple groups.
- Significance 0.001 < 0.05, which
means there is a significant
difference. Yes, there is a
difference between de average age
and the sizes of the households.
2