25% written exam (concept & theory)
25% PC exam (R skills)
50% group work (50% zip, 25% group, 25% ppt)
Concepts & theory
Data science
Top down view: generating value from data
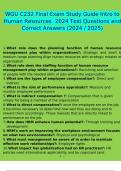
Knowledge pyramid
Data info knowledge wisdom
Raw data meaningful data
Blend of principles & methods
Ecology (domain) + computer science + maths and statistics
Trends in ecological research
Large, complex datasets
Specialised tech
Data driven multidisciplinary science
Analysing patterns
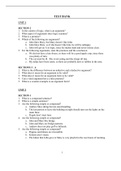
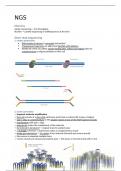
OSEMN pipeline
Obtaining data
Scrubbing (cleaning) data
Exploring data
Modelling data
INterpreting results
Effective workflow
Clear data structure
Concise
Understandable
Reproducible
Transferable
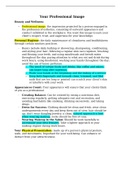
↓
, 1. Import
2. Tidy
3. Transform
4. Visualise
5. Model (transform & visualise again when needed)
6. Communicate
Data science (DS) vs empirical science
DS based on scientific method
But: not all data science = science
Different scale
Empirical science => small #correlations causal?
DS => can identify unlimited #correlations
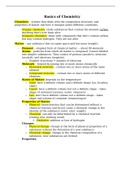
Data driven vs hypothesis driven
Data driven
- Inductive
- Starts with data analysis
Hypothesis driven
- Deductive
- Starts with hypothesis
3Vs of data
Volume
Variety
Velocity
But: DS project can also be based on smaller, simpler data
DS workflow
1. (acquire data)
2. Import
3. Tidy
4. Transform
5. Visualise
6. Model (transform & visualise again when needed) already 10 steps in
itself
7. Communicate
8. (act)
Gaining insight: transform, visualise, model
, Not 1 template workflow, but: similar steps
Data preparation (1)
Tidy data in workable format
- Table with rows & columns
- Numeric data
Convert categorical data dummy vars
- n classes n-1 dummy vars
Deal with missing data
- Remove obs (r)
- Remove vars (c)
- Data imputation
Correct errors or noise
Feature engineering (2)
Use domain knowledge to extract features from raw data
Compute interpretable features/vars from tidy data
- Data mining
Creativity
- Many features interactions
- Logical features simpler models
Takes lot of time
Algorithm selection (3)
Problem def
- Classification vs regression prediction
- Supervised vs unsupervised
- Prediction vs interference
Multiple algorithms per category/problem
All algorithms optimise cost/loss function
Feature standardisation (4)
Centering & scaling
- Standardisation = (x – mean)/sd
- Normalisation = (x – xmin)/(xmax – xmin)
Improves fit of algorithm
Improves inference of results
Set division (5)
Many data points: risk of overfitting
25% PC exam (R skills)
50% group work (50% zip, 25% group, 25% ppt)
Concepts & theory
Data science
Top down view: generating value from data
Knowledge pyramid
Data info knowledge wisdom
Raw data meaningful data
Blend of principles & methods
Ecology (domain) + computer science + maths and statistics
Trends in ecological research
Large, complex datasets
Specialised tech
Data driven multidisciplinary science
Analysing patterns
OSEMN pipeline
Obtaining data
Scrubbing (cleaning) data
Exploring data
Modelling data
INterpreting results
Effective workflow
Clear data structure
Concise
Understandable
Reproducible
Transferable
↓
, 1. Import
2. Tidy
3. Transform
4. Visualise
5. Model (transform & visualise again when needed)
6. Communicate
Data science (DS) vs empirical science
DS based on scientific method
But: not all data science = science
Different scale
Empirical science => small #correlations causal?
DS => can identify unlimited #correlations
Data driven vs hypothesis driven
Data driven
- Inductive
- Starts with data analysis
Hypothesis driven
- Deductive
- Starts with hypothesis
3Vs of data
Volume
Variety
Velocity
But: DS project can also be based on smaller, simpler data
DS workflow
1. (acquire data)
2. Import
3. Tidy
4. Transform
5. Visualise
6. Model (transform & visualise again when needed) already 10 steps in
itself
7. Communicate
8. (act)
Gaining insight: transform, visualise, model
, Not 1 template workflow, but: similar steps
Data preparation (1)
Tidy data in workable format
- Table with rows & columns
- Numeric data
Convert categorical data dummy vars
- n classes n-1 dummy vars
Deal with missing data
- Remove obs (r)
- Remove vars (c)
- Data imputation
Correct errors or noise
Feature engineering (2)
Use domain knowledge to extract features from raw data
Compute interpretable features/vars from tidy data
- Data mining
Creativity
- Many features interactions
- Logical features simpler models
Takes lot of time
Algorithm selection (3)
Problem def
- Classification vs regression prediction
- Supervised vs unsupervised
- Prediction vs interference
Multiple algorithms per category/problem
All algorithms optimise cost/loss function
Feature standardisation (4)
Centering & scaling
- Standardisation = (x – mean)/sd
- Normalisation = (x – xmin)/(xmax – xmin)
Improves fit of algorithm
Improves inference of results
Set division (5)
Many data points: risk of overfitting