Introduction to
Industrial Organization,
2nd Ed
Solutions to End-of-Chapter Exercises
Luı́s Cabral
This draft: March 2017
Please address questions or corrections to
,1 Introduction
1.1. Competition and performance.Empirical evidence from a sample of more than 600
UK firms indicates that, controlling for the quantity of inputs (that is, taking into account
the quantity of inputs), firm output is increasing in the number of competitors and
decreasing in market share and industry concentration.1 How do these results relate to the
ideas presented in this chapter?
Answer: In Section 1.2, I argued that one of the implications of market power is the
decline of productive efficiency. Controlling for input levels, the level of output is a
measure of productive efficiency. The number of competitors and the degree of
concentration are measures of the degree of competition (concentration is an inverse
indicator). The empirical evidence from UK firms is therefore consistent with the view
presented in the text.
,2 Consumers
2.1. Fruit salad. Adam and Barbara are big fruit salad fans (and both agree that the
more the better). However, their tastes differ regarding the way the salad is made. For
Adam, for each apple you throw in, there should be one and only one banana (if you give
him more than one banana, he will throw it way). For Barbara, as long at it’s fruit, it
doesn’t matter; in other words, all that counts is the number of pieces of fruit.
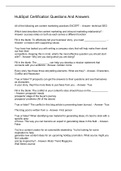
(a) Show what Adam’s and Barbara’s indifference curves look like.
Answer: Figure 2.1 depicts Adam’s and Barbara’s indifference curves (left and right
panels, respectively).
(b) Are apples and bananas substitutes or complements?
Answer: For Adam, apples and bananas are perfect complements; for Barbara, perfect
substitutes.
2.2. Village microbrew. Village microbrew raised its price from $10 to $12 a case
(wholesale). As a result, sales dropped from 10,500 to 8,100 (in units). Based on your
estimate of the demand elasticity, what percent change in sales would you predict if price
were cut from $10 to $9? What demand level would this correspond to?
Figure 2.1
Indifference curves: Adam and Barbara
bananas bananas
3 3
2 2
1 1
apples apples
1 2 3 1 2 3
3
, Answer: We can approximate it by the “change formula,”
∆q p 10, 500 − 8, 100 12
ϵ≈ = = −1.77
∆p q 10 − 12 8, 100
This is approximate, since we’re using discrete changes. If we assume that the elasticity of
demand is constant then we could get an exact solution by using the log formula:
∆ log q log 10500 − log 8100
ϵ= = = −1.42
∆ log p log 10 − log 12
Did revenue rise or fall? Since ϵ < −1, the increase in prices led to an overall fall in
revenue. (If you want to make sure, then calculate the revenues before and after the price
change.) If the elasticity is constant, what is the demand at $9? If the elasticity is constant
then the log formula calculates the elasticity exactly and in addition we know that:
log 10500 − log q9
= −1.42
log 10 − log 9
where q9 is the demand when the price is $9 per case, so (after a little bit of algebraic
manipulation)
10
q9 = exp log 10500 + 1.42 log = 12195
9
With constant demand elasticity, the percent variation method only gives an
approximation of the value of demand elasticity. Moreover, estimating demand for a
different price level will give a different value than the log formula. Specifically, the
demand estimate when price is $9 is given by
q9 = 10500 1 + (−1.77) × (−10%) = 12358
since the drop in price from 10 to 9 corresponds to a −10% variation
2.3. Demand elasticity. Based on the values in Table 3.2, provide an estimate of the
impact on sales revenues of a 10% increase in each product’s price.
Answer: Revenue is given by R = p × q. Differentiating, we get
dR = dp q + p dq
Dividing by R,
dR q p
= dp + dq
R R R
Since R = p q and ϵ = dq/dp p/q, we have
dR q p
= dp + dq
R R R
q p
= dp +
pq
dp dp p
= +
p p
dp dp
= +
4
Industrial Organization,
2nd Ed
Solutions to End-of-Chapter Exercises
Luı́s Cabral
This draft: March 2017
Please address questions or corrections to
,1 Introduction
1.1. Competition and performance.Empirical evidence from a sample of more than 600
UK firms indicates that, controlling for the quantity of inputs (that is, taking into account
the quantity of inputs), firm output is increasing in the number of competitors and
decreasing in market share and industry concentration.1 How do these results relate to the
ideas presented in this chapter?
Answer: In Section 1.2, I argued that one of the implications of market power is the
decline of productive efficiency. Controlling for input levels, the level of output is a
measure of productive efficiency. The number of competitors and the degree of
concentration are measures of the degree of competition (concentration is an inverse
indicator). The empirical evidence from UK firms is therefore consistent with the view
presented in the text.
,2 Consumers
2.1. Fruit salad. Adam and Barbara are big fruit salad fans (and both agree that the
more the better). However, their tastes differ regarding the way the salad is made. For
Adam, for each apple you throw in, there should be one and only one banana (if you give
him more than one banana, he will throw it way). For Barbara, as long at it’s fruit, it
doesn’t matter; in other words, all that counts is the number of pieces of fruit.
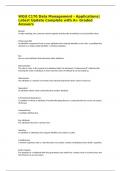
(a) Show what Adam’s and Barbara’s indifference curves look like.
Answer: Figure 2.1 depicts Adam’s and Barbara’s indifference curves (left and right
panels, respectively).
(b) Are apples and bananas substitutes or complements?
Answer: For Adam, apples and bananas are perfect complements; for Barbara, perfect
substitutes.
2.2. Village microbrew. Village microbrew raised its price from $10 to $12 a case
(wholesale). As a result, sales dropped from 10,500 to 8,100 (in units). Based on your
estimate of the demand elasticity, what percent change in sales would you predict if price
were cut from $10 to $9? What demand level would this correspond to?
Figure 2.1
Indifference curves: Adam and Barbara
bananas bananas
3 3
2 2
1 1
apples apples
1 2 3 1 2 3
3
, Answer: We can approximate it by the “change formula,”
∆q p 10, 500 − 8, 100 12
ϵ≈ = = −1.77
∆p q 10 − 12 8, 100
This is approximate, since we’re using discrete changes. If we assume that the elasticity of
demand is constant then we could get an exact solution by using the log formula:
∆ log q log 10500 − log 8100
ϵ= = = −1.42
∆ log p log 10 − log 12
Did revenue rise or fall? Since ϵ < −1, the increase in prices led to an overall fall in
revenue. (If you want to make sure, then calculate the revenues before and after the price
change.) If the elasticity is constant, what is the demand at $9? If the elasticity is constant
then the log formula calculates the elasticity exactly and in addition we know that:
log 10500 − log q9
= −1.42
log 10 − log 9
where q9 is the demand when the price is $9 per case, so (after a little bit of algebraic
manipulation)
10
q9 = exp log 10500 + 1.42 log = 12195
9
With constant demand elasticity, the percent variation method only gives an
approximation of the value of demand elasticity. Moreover, estimating demand for a
different price level will give a different value than the log formula. Specifically, the
demand estimate when price is $9 is given by
q9 = 10500 1 + (−1.77) × (−10%) = 12358
since the drop in price from 10 to 9 corresponds to a −10% variation
2.3. Demand elasticity. Based on the values in Table 3.2, provide an estimate of the
impact on sales revenues of a 10% increase in each product’s price.
Answer: Revenue is given by R = p × q. Differentiating, we get
dR = dp q + p dq
Dividing by R,
dR q p
= dp + dq
R R R
Since R = p q and ϵ = dq/dp p/q, we have
dR q p
= dp + dq
R R R
q p
= dp +
pq
dp dp p
= +
p p
dp dp
= +
4