Forces and Motion
(a) Units
Students should:
1.1 use the following units:
● kilogram (kg)
● metre (m)
● metre/second (m/s)
● metre/second2 (m/s2)
● newton (N)
● second (s)
● newton/kilogram (N/kg)
1.2P use the following units:
● newton metre (Nm)
● kilogram metre/second (kg m/s)
(b) Movement and position
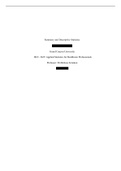
1.3 plot and explain distance−time graphs
We use distance time graphs to show how fast an
object moves over a distance.
● Unlike velocity time graphs the gradient
indicates the speed rather than acceleration
● you can show whether or not the person is
returning by going back down to 0 distance i.e. you
haven’t moved - gone back to 0 point
● A flat on the graph indicates that the object
is stationary rather than at a steady speed
,1.4 know and use the relationship between average speed, distance moved and time
taken:
1.5 practical: investigate the motion of everyday objects such as toy cars or tennis balls:
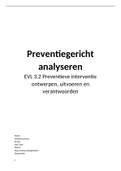
Experiment 1 - using colourful batons
1. Measure the baton with a 1m ruler - only measure the section with liquid
2. Turn the baton around and start the stopwatch
3. Stop the watch when the bubble reaches the top
4. Repeat
5. Use d=st to work out the speed of the bubble
Other things you could do
Draw lines at intervals and record when the top of the bubble reaches each interval
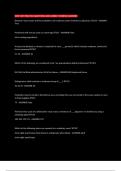
, Experiment 2 - using an air track
Also an electronic timer or data logger
1. Turn on the air pump and give the cart a push
2. Press ON on the data logger
3. Wait for the kart to reach the end of track and record its speed
The speed is measure by the light gates as the time is calculated between the two gates and
the distance is known this can be used to work out the speed using d=st
To increase speed put track at slope
The air holes lift the cart off the track reducing friction
Experiment 3 - light gates measuring stopping distance
1. Use a ramp which then flattens
2. Measure distance between ramp and light gate at foot of ramp
3. Push car down track
4. Then use ruler to measure stopping distance
5. Change height of ramp to make different speeds
6. Light gate will measure the time and the distance is set so you can see the effect of
speed on stopping distance
(a) Units
Students should:
1.1 use the following units:
● kilogram (kg)
● metre (m)
● metre/second (m/s)
● metre/second2 (m/s2)
● newton (N)
● second (s)
● newton/kilogram (N/kg)
1.2P use the following units:
● newton metre (Nm)
● kilogram metre/second (kg m/s)
(b) Movement and position
1.3 plot and explain distance−time graphs
We use distance time graphs to show how fast an
object moves over a distance.
● Unlike velocity time graphs the gradient
indicates the speed rather than acceleration
● you can show whether or not the person is
returning by going back down to 0 distance i.e. you
haven’t moved - gone back to 0 point
● A flat on the graph indicates that the object
is stationary rather than at a steady speed
,1.4 know and use the relationship between average speed, distance moved and time
taken:
1.5 practical: investigate the motion of everyday objects such as toy cars or tennis balls:
Experiment 1 - using colourful batons
1. Measure the baton with a 1m ruler - only measure the section with liquid
2. Turn the baton around and start the stopwatch
3. Stop the watch when the bubble reaches the top
4. Repeat
5. Use d=st to work out the speed of the bubble
Other things you could do
Draw lines at intervals and record when the top of the bubble reaches each interval
, Experiment 2 - using an air track
Also an electronic timer or data logger
1. Turn on the air pump and give the cart a push
2. Press ON on the data logger
3. Wait for the kart to reach the end of track and record its speed
The speed is measure by the light gates as the time is calculated between the two gates and
the distance is known this can be used to work out the speed using d=st
To increase speed put track at slope
The air holes lift the cart off the track reducing friction
Experiment 3 - light gates measuring stopping distance
1. Use a ramp which then flattens
2. Measure distance between ramp and light gate at foot of ramp
3. Push car down track
4. Then use ruler to measure stopping distance
5. Change height of ramp to make different speeds
6. Light gate will measure the time and the distance is set so you can see the effect of
speed on stopping distance