CHAPTER 2
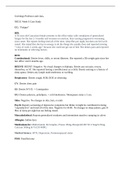
2-1. How many hours will a person allocate to leisure activities if her indifference
curves between consumption and goods are concave to the origin?
A worker will either work all available time or will not work at all. As drawn in Figure A,
point B is preferred to points A and C. Thus, the worker chooses not to enter the labor
market. As drawn in Figure B, point C is preferred to both points A and B. Thus, the worker
chooses not to consume any leisure and to work all available time.
Figure A Figure B
Goods Goods
C
C
U1
U1
A A
U0 U0
B B
Hours of Leisure Hours of Leisure
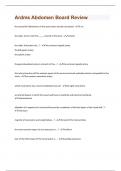
2-2. What is the effect of an increase in the price of market goods on a worker’s
reservation wage, probability of entering the labor force, and hours of work?
Suppose the price of market goods increases from p to p and the person’s non-labor
income is V. If she chooses not to work, she can purchase V/p units of consumption after
the price change, whereas she could have consumed V/p units of consumption prior to the
,price increase. Thus, her endowment point has moved from E to E in Figure A (on the next
page). Under normal conditions, including that leisure is a normal good, the indifference
curve is steeper as we move up a vertical line, indicating that the slope of the indifference
curve is steeper at E than at E . Thus, an increase in the price of goods lowers the
reservation wage and makes the person more likely to work.
[Figure A is on the next page.]
, Figure A.
Goods
E
V/p
E
V/p
0 T Hours of
Leisure
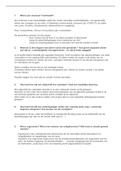
To simplify the illustration of the effect on hours of work, assume for simplicity that V = 0.
The increase in the price of goods shifts the budget line from FE to GE in Figure B below,
moving the worker from P to point R. This shift induces both an income effect and a
substitution effect. The price increase lowers the person’s real wage rate, increasing the
demand for leisure and leading to fewer hours of work (the substitution effect). This
substitution effect is illustrated by the move from point P to point Q in Figure B. The price
increase also reduces the worker’s wealth, lowering the demand for leisure and leading to
more hours of work (the income effect). This income effect is illustrated by the move from Q
to R. As drawn the income effect dominates the substitution effect and the price increase
lowers the demand for leisure and increases hours of work. It is, of course, possible for the
substitution effect to dominate the income effect (not pictured), so that hours of work
decreases. Thus, without further restrictions on preferences, an increase in the price of
market goods has an ambiguous effect on hours worked.
, Figure B.
Goods
F
P
Q
G R
E
T
Hours of Leisure
2-1. How many hours will a person allocate to leisure activities if her indifference
curves between consumption and goods are concave to the origin?
A worker will either work all available time or will not work at all. As drawn in Figure A,
point B is preferred to points A and C. Thus, the worker chooses not to enter the labor
market. As drawn in Figure B, point C is preferred to both points A and B. Thus, the worker
chooses not to consume any leisure and to work all available time.
Figure A Figure B
Goods Goods
C
C
U1
U1
A A
U0 U0
B B
Hours of Leisure Hours of Leisure
2-2. What is the effect of an increase in the price of market goods on a worker’s
reservation wage, probability of entering the labor force, and hours of work?
Suppose the price of market goods increases from p to p and the person’s non-labor
income is V. If she chooses not to work, she can purchase V/p units of consumption after
the price change, whereas she could have consumed V/p units of consumption prior to the
,price increase. Thus, her endowment point has moved from E to E in Figure A (on the next
page). Under normal conditions, including that leisure is a normal good, the indifference
curve is steeper as we move up a vertical line, indicating that the slope of the indifference
curve is steeper at E than at E . Thus, an increase in the price of goods lowers the
reservation wage and makes the person more likely to work.
[Figure A is on the next page.]
, Figure A.
Goods
E
V/p
E
V/p
0 T Hours of
Leisure
To simplify the illustration of the effect on hours of work, assume for simplicity that V = 0.
The increase in the price of goods shifts the budget line from FE to GE in Figure B below,
moving the worker from P to point R. This shift induces both an income effect and a
substitution effect. The price increase lowers the person’s real wage rate, increasing the
demand for leisure and leading to fewer hours of work (the substitution effect). This
substitution effect is illustrated by the move from point P to point Q in Figure B. The price
increase also reduces the worker’s wealth, lowering the demand for leisure and leading to
more hours of work (the income effect). This income effect is illustrated by the move from Q
to R. As drawn the income effect dominates the substitution effect and the price increase
lowers the demand for leisure and increases hours of work. It is, of course, possible for the
substitution effect to dominate the income effect (not pictured), so that hours of work
decreases. Thus, without further restrictions on preferences, an increase in the price of
market goods has an ambiguous effect on hours worked.
, Figure B.
Goods
F
P
Q
G R
E
T
Hours of Leisure