Psychometrics SPSS/R Summary:
Questions for SPSS - are not highlighted.
Questions for R programme - are highlighted in light blue.
Yellow highlighted terms are likely to come up.
General Tricks/tips:
To highlight more items at once press one, then do caps lock and press up to here.
To highlight all items: Control (Strg), A
To save a graph in R: select the graph/window, file, save as.
Calculate the scale scores (by Compute a new variable
finding the mean of the items Transform, compute variable, “function group” box - scroll down, press statistical, press mean in “functions
concerned) and special values” box.
Target variable = name of new variable
Numeric expression - enter variables with a comma in between, or with … to ….
Careful:
- make sure numeric expression looks like: MEAN.n(lokfa1 to lokfa7, lokfa9 to lokfa11) REPLACE the
.n for number of items a participants should have answered at least (missing). Should be half of the
items answered at least.
- Make sure you have the correct variables (check annex for which ones to include/exclude.)
- You can check that a new variable was made by looking in the variable view all the way to the right
- Is a high/low score in the new variable a positive thing or negative?
Report the scales:
- You want to show that the new variables which are means of the other data, are actually fitting the
scale shown in the annex.
Create a report about the Analyse, descriptive statistics, descriptives, put in new variables, request mean, sd, max, min in options.
research group This gives you a table in the output called “descriptive statistics”
Produce a graph of the Histogram: graphs, legacy dialogues, histogram, just put in one of the two scale scores (new variables).
distribution of scale scores Nothing else. Run it and then do the same with the other new group variable.
Describe the skew(left or right?) and if there are 1 or more peaks.
OR Boxplot:
Creating norms of the scales Calculate the z-scores:
,(calculate normed scores for Analyse, descriptive stats, descriptives, add the two scale scores, tick the box for “save standardized values
the scales) should have made as variables” and go to descriptives and unclick everything, mean etc.
scale scores for this. The z scores are then shown in the data file as a new variable
Careful:
- In options make sure to unselect the descriptions (such as max, min, sd)
Calculate the t-scores:
Transform, compute variable, press reset, to have a fresh start, use formula: t= (10* zscorevariable) +50.
Enter new name with “t”
Determine percentile scores:
Transform, rank cases, use original scale scores (NOT Z or T score!!)
rank types - uncheck “rank” and check “fractional rank as %”.
Ties - unclick mean, and click high
This gives a 2 new variables in data view with a P in front
Note: if you want to, go to variable view, and change the number of decimals to 0, to have whole
percentages.
Create a norm table Norm table = table of raw scores + the three different normed scores: the z-scores, the T-scores and the
percentile scores
Analyse, reports, case summaries,
Do each of the two groups separately. First group 1 then group 2
- Put scale score (the original one) into “grouping variable”, and Z, t, and percentile ones in “variables”
- Unselect “display cases”
- Go to the statistics button - put “number of cases” back to statistics, and put “mean” to the “cell
statistics” box on the right.
- Continue, okay. “Case summaries” table shows up in output
- (Then do the same for the other variable (Ex: one for lokma, once again for lokfa))
Check whether minimum and maximum are correct: look at the top row and bottom row. Percentiles need to
be between 0 and 100, t scores should be around 50, and z scores should be 0
Week 2 reliability
Split-Half reliability How to split the data (as it assumes the two halves are equivalent):
, Analyse, descriptive statistics, Descriptives, enter all variables of interest into “variables” e.g. emotional
neglect, lokfa items, if you also need to do e.g. discipline lokfa items, do this after finishing the process for
em. Neglect.
- Options →mean and std - you get a table, and pair the ones closest together. 1 of the pair goes in
group 1, the other in group 2. Best to take a piece of paper and write down the two groups.
- Make sure you are taking the variables from the correct scales (Ex: emotional neglect, or discipline)
do it for both if necessary.
Split half reliability:
Analyse, scale, reliability analysis, based on the groups made above, items: put the items from one group
first, and then followed by the second group made (no gaps, just continue with the second one). You can
use the strg button, the order does not matter, as long as one group is before the other.
- Statistics: select the option descriptives for - scale
- Model: Change it to SPLIT HALF (or else everything wrong)
- (Note, remember if you are doing 2 scales, you need to do this twice (emo + discipline).
What is the value of the split half reliability?
Check “reliability statistics table”, spearman-Brown coefficient - equal
Look at “spearman's equal”
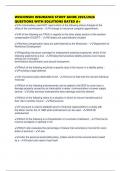
Conclusions about the reliability:
1. Cotan norms:
Tests for important Tests for less Tests for
decisions on an important decisions research on
individual level on an individual group level
level
good Rxx >(or equal to) Rxx >(or equal to) Rxx >(or equal
0.90 0.80 to) 0.70
sufficient 0.80 <(or equal to) 0.70 <(or equal to) 0.60 <(or equal
Rxx > 0.90 Rxx > 0.80 to) Rxx > 0.70
insufficient Rxx <(or equal to) Rxx<(or equal to) Rxx <(or equal
0.80 0.70 to) 0.60
Questions for SPSS - are not highlighted.
Questions for R programme - are highlighted in light blue.
Yellow highlighted terms are likely to come up.
General Tricks/tips:
To highlight more items at once press one, then do caps lock and press up to here.
To highlight all items: Control (Strg), A
To save a graph in R: select the graph/window, file, save as.
Calculate the scale scores (by Compute a new variable
finding the mean of the items Transform, compute variable, “function group” box - scroll down, press statistical, press mean in “functions
concerned) and special values” box.
Target variable = name of new variable
Numeric expression - enter variables with a comma in between, or with … to ….
Careful:
- make sure numeric expression looks like: MEAN.n(lokfa1 to lokfa7, lokfa9 to lokfa11) REPLACE the
.n for number of items a participants should have answered at least (missing). Should be half of the
items answered at least.
- Make sure you have the correct variables (check annex for which ones to include/exclude.)
- You can check that a new variable was made by looking in the variable view all the way to the right
- Is a high/low score in the new variable a positive thing or negative?
Report the scales:
- You want to show that the new variables which are means of the other data, are actually fitting the
scale shown in the annex.
Create a report about the Analyse, descriptive statistics, descriptives, put in new variables, request mean, sd, max, min in options.
research group This gives you a table in the output called “descriptive statistics”
Produce a graph of the Histogram: graphs, legacy dialogues, histogram, just put in one of the two scale scores (new variables).
distribution of scale scores Nothing else. Run it and then do the same with the other new group variable.
Describe the skew(left or right?) and if there are 1 or more peaks.
OR Boxplot:
Creating norms of the scales Calculate the z-scores:
,(calculate normed scores for Analyse, descriptive stats, descriptives, add the two scale scores, tick the box for “save standardized values
the scales) should have made as variables” and go to descriptives and unclick everything, mean etc.
scale scores for this. The z scores are then shown in the data file as a new variable
Careful:
- In options make sure to unselect the descriptions (such as max, min, sd)
Calculate the t-scores:
Transform, compute variable, press reset, to have a fresh start, use formula: t= (10* zscorevariable) +50.
Enter new name with “t”
Determine percentile scores:
Transform, rank cases, use original scale scores (NOT Z or T score!!)
rank types - uncheck “rank” and check “fractional rank as %”.
Ties - unclick mean, and click high
This gives a 2 new variables in data view with a P in front
Note: if you want to, go to variable view, and change the number of decimals to 0, to have whole
percentages.
Create a norm table Norm table = table of raw scores + the three different normed scores: the z-scores, the T-scores and the
percentile scores
Analyse, reports, case summaries,
Do each of the two groups separately. First group 1 then group 2
- Put scale score (the original one) into “grouping variable”, and Z, t, and percentile ones in “variables”
- Unselect “display cases”
- Go to the statistics button - put “number of cases” back to statistics, and put “mean” to the “cell
statistics” box on the right.
- Continue, okay. “Case summaries” table shows up in output
- (Then do the same for the other variable (Ex: one for lokma, once again for lokfa))
Check whether minimum and maximum are correct: look at the top row and bottom row. Percentiles need to
be between 0 and 100, t scores should be around 50, and z scores should be 0
Week 2 reliability
Split-Half reliability How to split the data (as it assumes the two halves are equivalent):
, Analyse, descriptive statistics, Descriptives, enter all variables of interest into “variables” e.g. emotional
neglect, lokfa items, if you also need to do e.g. discipline lokfa items, do this after finishing the process for
em. Neglect.
- Options →mean and std - you get a table, and pair the ones closest together. 1 of the pair goes in
group 1, the other in group 2. Best to take a piece of paper and write down the two groups.
- Make sure you are taking the variables from the correct scales (Ex: emotional neglect, or discipline)
do it for both if necessary.
Split half reliability:
Analyse, scale, reliability analysis, based on the groups made above, items: put the items from one group
first, and then followed by the second group made (no gaps, just continue with the second one). You can
use the strg button, the order does not matter, as long as one group is before the other.
- Statistics: select the option descriptives for - scale
- Model: Change it to SPLIT HALF (or else everything wrong)
- (Note, remember if you are doing 2 scales, you need to do this twice (emo + discipline).
What is the value of the split half reliability?
Check “reliability statistics table”, spearman-Brown coefficient - equal
Look at “spearman's equal”
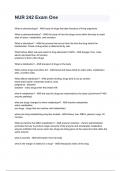
Conclusions about the reliability:
1. Cotan norms:
Tests for important Tests for less Tests for
decisions on an important decisions research on
individual level on an individual group level
level
good Rxx >(or equal to) Rxx >(or equal to) Rxx >(or equal
0.90 0.80 to) 0.70
sufficient 0.80 <(or equal to) 0.70 <(or equal to) 0.60 <(or equal
Rxx > 0.90 Rxx > 0.80 to) Rxx > 0.70
insufficient Rxx <(or equal to) Rxx<(or equal to) Rxx <(or equal
0.80 0.70 to) 0.60