Name: Date:
Student Exploration: Distance-Time and Velocity-Time Graphs
[NOTE TO TEACHERS AND STUDENTS: This lesson was designed as a follow-up to the
Distance-Time Graphs Gizmo™. We recommend you complete that activity before this one.]
Vocabulary: displacement, distance traveled, slope, speed, velocity
Prior Knowledge Questions (Do these BEFORE using the Gizmo.)
Dora runs one lap around the track, finishing where she started. Clark
runs a 100-yard dash along the straight side of the track.
1. Which runner traveled a greater distance? Dora
2. Which runner had a greater change in position, start to finish?
Clark_
Gizmo Warm-up
The Distance-Time Graphs Gizmo shows a dynamic graph of the position of a runner over time.
The Distance-Time and Velocity-Time Graphs Gizmo includes that same graph and adds two
new ones: a velocity vs. time graph and a distance traveled vs. time graph.
The graph shown below (and in the Gizmo) shows a runner’s position (or distance from the
starting line) over time. This is most commonly called a position-time graph.
Check that the Number of Points is 2. Turn on Show graph
and Show animation for both Runner 1 and Runner 2.
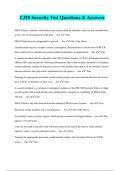
1. Drag the points to create the graph shown to the right.
• Runner 1’s line (the red one) should have
endpoints at (0, 0) and (4, 40).
• Runner 2’s line (the blue one) should have
endpoints at (0, 40) and (4, 20).
2. Click the green Start button on the stopwatch. Watch the two runners carefully. In what two
ways are the runners’ motions different? Runner 1 is running faster than runner 2 in an
opposite direction.
,
Student Exploration: Distance-Time and Velocity-Time Graphs
[NOTE TO TEACHERS AND STUDENTS: This lesson was designed as a follow-up to the
Distance-Time Graphs Gizmo™. We recommend you complete that activity before this one.]
Vocabulary: displacement, distance traveled, slope, speed, velocity
Prior Knowledge Questions (Do these BEFORE using the Gizmo.)
Dora runs one lap around the track, finishing where she started. Clark
runs a 100-yard dash along the straight side of the track.
1. Which runner traveled a greater distance? Dora
2. Which runner had a greater change in position, start to finish?
Clark_
Gizmo Warm-up
The Distance-Time Graphs Gizmo shows a dynamic graph of the position of a runner over time.
The Distance-Time and Velocity-Time Graphs Gizmo includes that same graph and adds two
new ones: a velocity vs. time graph and a distance traveled vs. time graph.
The graph shown below (and in the Gizmo) shows a runner’s position (or distance from the
starting line) over time. This is most commonly called a position-time graph.
Check that the Number of Points is 2. Turn on Show graph
and Show animation for both Runner 1 and Runner 2.
1. Drag the points to create the graph shown to the right.
• Runner 1’s line (the red one) should have
endpoints at (0, 0) and (4, 40).
• Runner 2’s line (the blue one) should have
endpoints at (0, 40) and (4, 20).
2. Click the green Start button on the stopwatch. Watch the two runners carefully. In what two
ways are the runners’ motions different? Runner 1 is running faster than runner 2 in an
opposite direction.
,