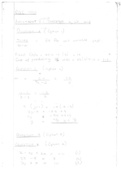
One-side ANOVA
= How can we investigate with a certain level of (statistical) confidence, what differences
there might be between the groups
Comparing the variability between groups against variability within groups
PV (with >2 groups) -
OV - quantitative
categorical
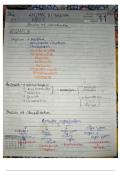
1. Can you do the one-side ANOVA?
OutcomeVariable (OV) = Quantitative
Predictor Variable (PV) = Categorical with more than 2 groups.
Variance is homogenous across groups – Levens test
Residuals are normally distributed – in this class we don’t test for this.
Groups are roughly equally sized – in this class they always are
Our subjects can only be in one group (between subjects design) – independent
groups, je kan niet in 2 groepen zitten
2. Check Levens (>0.05) variance is homogenous across groups
3. Write down hypotheses
H0: There is no difference (in means) from X across Y
H1: There is a difference (in means) from X across Y
4. Check p value one-side ANOVA (there is a difference)
5. Calculate F-value – to make sure you also take the sample size with your
calculation
Hypotheses F-value
, H0: 𝜇1 =𝜇2 =...=𝜇i “There is no difference in mean across the different categories”
H1:𝜇𝑖 ≠𝜇𝑗 for some 𝑖 and 𝑗. “There is a difference in the means.”
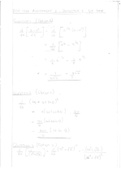
Formula = Mean square ‘between groups’ (MSm)/ mean square ‘within groups’ (MSr)
Formula sheet =
Deze vergelijk je met het nummer in de table (F-table)
Search in the F-value for F1 (k – 1) + F2 (n – k)
K = number of groups
N = number of observations
6. Calculate R2 (proportion of total variance)
How good is your model?
Formula = sum of squares between groups (SSm)/ sum of squares total (SSt)* 100 =
Formula sheet =
7. Do PostHoc test (difference between groups)
Difference One-sided ANOVA and factorial ANOVA
- One-sided ANOVA = examining how much variance in our data can be explained by
our independent variable
- Factorial ANOVA = examining how much variance in our data can be explained by
our independent variables (>1)
- Factorial ANOVA not only looks at the main effects of the PVs but also at their
interaction effect on the OV
= How can we investigate with a certain level of (statistical) confidence, what differences
there might be between the groups
Comparing the variability between groups against variability within groups
PV (with >2 groups) -
OV - quantitative
categorical
1. Can you do the one-side ANOVA?
OutcomeVariable (OV) = Quantitative
Predictor Variable (PV) = Categorical with more than 2 groups.
Variance is homogenous across groups – Levens test
Residuals are normally distributed – in this class we don’t test for this.
Groups are roughly equally sized – in this class they always are
Our subjects can only be in one group (between subjects design) – independent
groups, je kan niet in 2 groepen zitten
2. Check Levens (>0.05) variance is homogenous across groups
3. Write down hypotheses
H0: There is no difference (in means) from X across Y
H1: There is a difference (in means) from X across Y
4. Check p value one-side ANOVA (there is a difference)
5. Calculate F-value – to make sure you also take the sample size with your
calculation
Hypotheses F-value
, H0: 𝜇1 =𝜇2 =...=𝜇i “There is no difference in mean across the different categories”
H1:𝜇𝑖 ≠𝜇𝑗 for some 𝑖 and 𝑗. “There is a difference in the means.”
Formula = Mean square ‘between groups’ (MSm)/ mean square ‘within groups’ (MSr)
Formula sheet =
Deze vergelijk je met het nummer in de table (F-table)
Search in the F-value for F1 (k – 1) + F2 (n – k)
K = number of groups
N = number of observations
6. Calculate R2 (proportion of total variance)
How good is your model?
Formula = sum of squares between groups (SSm)/ sum of squares total (SSt)* 100 =
Formula sheet =
7. Do PostHoc test (difference between groups)
Difference One-sided ANOVA and factorial ANOVA
- One-sided ANOVA = examining how much variance in our data can be explained by
our independent variable
- Factorial ANOVA = examining how much variance in our data can be explained by
our independent variables (>1)
- Factorial ANOVA not only looks at the main effects of the PVs but also at their
interaction effect on the OV