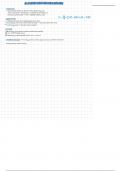
Demand: Quantities of a good or service that consumers are willing and able to buy at various prices.
Quantity demanded: The amount of goods and services that consumers are willing and able to buy at various prices.
The quantity demanded is a function of:
O The price of the good
O The price of other goods (complementary goods & substitutes)
O Consumer income
O Consumer tastes
Demand Schedule: The table that shows the relationship between price of a good and quantity demanded, holding other
things constant.
Law of demand: The quantity demanded of a good falls when price rises, ceteris paribus.
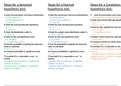
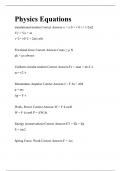
The demand curve: The curve that shows the relationship between price and quantity demanded
Demand curve Increase in demand Decrease in demand
Price
Price Price
D2
D D1
D1
D2
Factors that may lead to a shift in demand:
O Income normal goods (an increase in income leads to an increase in quantity demanded)
Inferior goods (an increase in income leads to a decrease in quantity demanded)
O Price of related goods (complementary goods and substitutes)
O Consumer tastes and habits (do you like or dislike the good, addictive goods)
O Expectations (income and prices)
O Number of buyers (size of the population)
Only a change in price will lead to a movement along the demand curve.
Supply: Quantity of goods and services that the same amount of sellers are willing and able to sell at various prices.
Quantity supplied: The quantity of goods and services that the same amount of sellers are willing and able to sell at each
specific price.
The supply curve: The curve that show the relationship between price and quantity supplied.
The law of supply: The quantity supplied of a good rises when the price of that good rises, ceteris paribus.
Quantity demanded: The amount of goods and services that consumers are willing and able to buy at various prices.
The quantity demanded is a function of:
O The price of the good
O The price of other goods (complementary goods & substitutes)
O Consumer income
O Consumer tastes
Demand Schedule: The table that shows the relationship between price of a good and quantity demanded, holding other
things constant.
Law of demand: The quantity demanded of a good falls when price rises, ceteris paribus.
The demand curve: The curve that shows the relationship between price and quantity demanded
Demand curve Increase in demand Decrease in demand
Price
Price Price
D2
D D1
D1
D2
Factors that may lead to a shift in demand:
O Income normal goods (an increase in income leads to an increase in quantity demanded)
Inferior goods (an increase in income leads to a decrease in quantity demanded)
O Price of related goods (complementary goods and substitutes)
O Consumer tastes and habits (do you like or dislike the good, addictive goods)
O Expectations (income and prices)
O Number of buyers (size of the population)
Only a change in price will lead to a movement along the demand curve.
Supply: Quantity of goods and services that the same amount of sellers are willing and able to sell at various prices.
Quantity supplied: The quantity of goods and services that the same amount of sellers are willing and able to sell at each
specific price.
The supply curve: The curve that show the relationship between price and quantity supplied.
The law of supply: The quantity supplied of a good rises when the price of that good rises, ceteris paribus.