Statistics in Neurosciences
Basics – Field chapter 1-5
The empirical research cycle:
1. Start with a question: observation
Prompted by observations of patterns in the world around you.
Why is observation not enough by itself?
More rational approach à Research question defines the scope of the
investigation.
2. Generate a theory:
Organized statement about relationships between things.
Makes predictions about future observations.
Serves as a framework for your statistical model.
3. Generate a hypothesis:
Specific and falsifiable.
Testable instantiation of the theory.
4. Collect data to test the hypothesis:
Data (results) collected from a study will either:
Confirm the prediction and increase confidence in the theory (OR).
Not confirm the prediction and decrease confidence in the theory.
No single set of data will prove or disprove a theory!
Replication in multiple samples critical to science.
5. Testing your hypothesis:
You have a research question and you’ve collected and examined your data,
what’s next?
Statistics are used to see whether there is a significant association between two
or more variables.
Significant is somewhat arbitrary, but we use it to mean that is is unlikely to
observe such a large effect/association by chance alone under the null hypothesis
(if, in reality, there is no effect/association).
1
,How do you collect data?
Types of study design:
Non-experimental:
o Observational, archival, case-studies and survey.
o Non-invasive à avoid practical and ethical constraints.
o Cannot infer causation.
Experimental:
o Manipulate variables that interest us while other variables are kept under
control; scientist has ‘complete control over all aspects’.
o Explore causes and their effects.
o Can infer causation.
Variable: a term referring to things that can take on different values in a scientific
investigation.
Controlled
Measured
Multiple variables are often combined together into a dataset.
Data: individual pieces of information, such as the values of a number of variables. A dataset
is necessary to the scientific method.
Type of variables:
Independent (IV): manipulated by the experimenter. The effect of the IV is the focus
of the study
o Predictor
Dependent (DV): may change in response to an IV.
o Outcome
Qualitative data:
Categorial: discrete.
o Nominal: categories are distinguished, but not ordered (gender, religion,
politics, species).
o Ordinal: categories are distinguished and ordered, but difference between
categories not defined (ranks in the army, outcome matches (1 st, 2nd, 3rd place),
educational attainment level).
Numeric: continuous.
o Ratio: absolute zero (weight, height, age, reaction time).
o Interval: distance between different categories is meaningful; we can
add/subtract, but not multiply; no absolute zero (temperature, scores on a test,
IQ).
The measurement error affects interpretation and should always be considered in study
design and limitations.
Confounding variables: an external factor that has an effect on both variables in a
correlational study is the one underlying the effect on both other variables.
Explore your data:
Not technically part of the scientific method, but a very important step after collecting
data and before analyzing it. You want to be sure that your data is correct.
Descriptive statistics give you important information about your variable(s), especially
for error checking.
Graphs and frequency distributions quickly identify trends and potential problems.
2
,Data checking: tables and graphs can easily identify when there is a problem with your
data, e.g. impossible values, incorrectly entered data.
Descriptive statistics:
Central tendency:
Mode: nominal variables; value with the highest frequency.
Median: ordinal variables; middle value after ranking (50 percentile).
Mean: interval/ratio variables; all values/N.
Dispersion:
Variance: s² or ² = ; also called the mean deviation from the
mean.
the top part of the formula is called the sum of squared error (SS).
If you have more variance, than the error is higher.
The average error between the mean an the observations made.
Standard deviation: SD (s or ) =
Ensures that the measure of average error is in the same units as the original
measure.
Standard error:
Range: distance between the min. and max. value.
Confidence interval: boundaries within which we believe the population will fall.
95% of the z-scores scores fall between -1.96 and +1.96
Reported as: [1.32, 4.56]
Percentile: each score relative to others in a standardized (0-100) distribution.
25th percentile (first quartile)
50th percentile (second quartile)
75th percentile (third quartile)
Interquartile range: scores between the 25th and 75th percentile; not sensitive to
outliers (extreme values).
Analyze Descriptive Statistics Explore
Statistical models: aim is always to develop a model that describes the data well (fits the
observed values with a little error) and makes accurate predictions about new data points.
Outcomei = model + errori
The simplest model is the means model or other measure of central tendency for other data
types.
Outcomei = mean + errori
The error is the sum of squared errors, when it is large than the model is not a good fit for
the data.
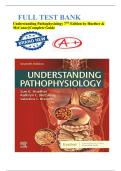
Deviation:
The amount of variance is a measure of model fit à how well does
the model describe the data?
To find a score in a dataset depends on the variance; the larger
the variance, the more likely and the less chance that a score is
outlying.
When the variance in both groups is high, it’s more difficult to say
whether the two groups are really different.
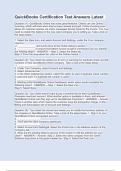
Do men and women differ in blood pressure?
Do men and women come from the same population?
3
, Variation:
Systematic: due to the known/manipulated factors; between group variance.
Between HZ and WT.
Between mice that did/didn’t get the foot shock.
Between cells that were/were not treated with the virus.
Unsystematic: due to random/unknown factors; within group variance.
Between mice with exactly the same genetic make-up.
Between cells from the same genotype/pup/week/well.
A test statistic (t/F) is usually the ratio between systematic/unsystematic variance.
explained by the model / not explained by the model.
Significant: used to mean that it is unlikely to observe such a large effect/association by
chance alone under the null hypothesis (if, in reality, there is no effect/association).
Sampling theory: if we could collect all data, we wouldn’t need inferential statistics!
We use sample estimates (observed values) to represent population parameters (known/true
values), taking into account the variability inherent in sampling.
Standard error: the SD of sample means.
Take multiple samples from a population.
Calculate the mean of each sample.
Variation in the sample of means is the standard error.
This is not practical to collect such samples, so:
The larger the variation in your population, the larger SE unless your samples are large.
Central limit theorem: if samples are large enough (>30), the sampling distribution is normal
with:
in a distribution of sample means.
Standard error vs. standard deviation:
The SD is the difference between observation and mean; between the true value and
the estimated value (or model). It concerns variation within 1 sample.
The SE is a measure of sampling variation; variation you expect in your sample just
by chance alone. It concerns variation across multiple samples and refers to variation
of a parameter estimate between samples.
The smaller SD or SE, the more homogeneous the population.
Statistical inference: when analyzing data within a sample, you obtain a parameter estimate
(mean, mean difference, association coefficient) and a corresponding measure of sampling
variability (SD, SE). But how does this relate back to the research question?
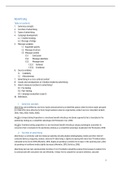
Probability dense function: the worked out mathematical formula for several common
distributions, like the normal distribution. We plot the value of the variable (x) against the
probability of it occurring (y). The resulting curve is the probability distribution.
4
Basics – Field chapter 1-5
The empirical research cycle:
1. Start with a question: observation
Prompted by observations of patterns in the world around you.
Why is observation not enough by itself?
More rational approach à Research question defines the scope of the
investigation.
2. Generate a theory:
Organized statement about relationships between things.
Makes predictions about future observations.
Serves as a framework for your statistical model.
3. Generate a hypothesis:
Specific and falsifiable.
Testable instantiation of the theory.
4. Collect data to test the hypothesis:
Data (results) collected from a study will either:
Confirm the prediction and increase confidence in the theory (OR).
Not confirm the prediction and decrease confidence in the theory.
No single set of data will prove or disprove a theory!
Replication in multiple samples critical to science.
5. Testing your hypothesis:
You have a research question and you’ve collected and examined your data,
what’s next?
Statistics are used to see whether there is a significant association between two
or more variables.
Significant is somewhat arbitrary, but we use it to mean that is is unlikely to
observe such a large effect/association by chance alone under the null hypothesis
(if, in reality, there is no effect/association).
1
,How do you collect data?
Types of study design:
Non-experimental:
o Observational, archival, case-studies and survey.
o Non-invasive à avoid practical and ethical constraints.
o Cannot infer causation.
Experimental:
o Manipulate variables that interest us while other variables are kept under
control; scientist has ‘complete control over all aspects’.
o Explore causes and their effects.
o Can infer causation.
Variable: a term referring to things that can take on different values in a scientific
investigation.
Controlled
Measured
Multiple variables are often combined together into a dataset.
Data: individual pieces of information, such as the values of a number of variables. A dataset
is necessary to the scientific method.
Type of variables:
Independent (IV): manipulated by the experimenter. The effect of the IV is the focus
of the study
o Predictor
Dependent (DV): may change in response to an IV.
o Outcome
Qualitative data:
Categorial: discrete.
o Nominal: categories are distinguished, but not ordered (gender, religion,
politics, species).
o Ordinal: categories are distinguished and ordered, but difference between
categories not defined (ranks in the army, outcome matches (1 st, 2nd, 3rd place),
educational attainment level).
Numeric: continuous.
o Ratio: absolute zero (weight, height, age, reaction time).
o Interval: distance between different categories is meaningful; we can
add/subtract, but not multiply; no absolute zero (temperature, scores on a test,
IQ).
The measurement error affects interpretation and should always be considered in study
design and limitations.
Confounding variables: an external factor that has an effect on both variables in a
correlational study is the one underlying the effect on both other variables.
Explore your data:
Not technically part of the scientific method, but a very important step after collecting
data and before analyzing it. You want to be sure that your data is correct.
Descriptive statistics give you important information about your variable(s), especially
for error checking.
Graphs and frequency distributions quickly identify trends and potential problems.
2
,Data checking: tables and graphs can easily identify when there is a problem with your
data, e.g. impossible values, incorrectly entered data.
Descriptive statistics:
Central tendency:
Mode: nominal variables; value with the highest frequency.
Median: ordinal variables; middle value after ranking (50 percentile).
Mean: interval/ratio variables; all values/N.
Dispersion:
Variance: s² or ² = ; also called the mean deviation from the
mean.
the top part of the formula is called the sum of squared error (SS).
If you have more variance, than the error is higher.
The average error between the mean an the observations made.
Standard deviation: SD (s or ) =
Ensures that the measure of average error is in the same units as the original
measure.
Standard error:
Range: distance between the min. and max. value.
Confidence interval: boundaries within which we believe the population will fall.
95% of the z-scores scores fall between -1.96 and +1.96
Reported as: [1.32, 4.56]
Percentile: each score relative to others in a standardized (0-100) distribution.
25th percentile (first quartile)
50th percentile (second quartile)
75th percentile (third quartile)
Interquartile range: scores between the 25th and 75th percentile; not sensitive to
outliers (extreme values).
Analyze Descriptive Statistics Explore
Statistical models: aim is always to develop a model that describes the data well (fits the
observed values with a little error) and makes accurate predictions about new data points.
Outcomei = model + errori
The simplest model is the means model or other measure of central tendency for other data
types.
Outcomei = mean + errori
The error is the sum of squared errors, when it is large than the model is not a good fit for
the data.
Deviation:
The amount of variance is a measure of model fit à how well does
the model describe the data?
To find a score in a dataset depends on the variance; the larger
the variance, the more likely and the less chance that a score is
outlying.
When the variance in both groups is high, it’s more difficult to say
whether the two groups are really different.
Do men and women differ in blood pressure?
Do men and women come from the same population?
3
, Variation:
Systematic: due to the known/manipulated factors; between group variance.
Between HZ and WT.
Between mice that did/didn’t get the foot shock.
Between cells that were/were not treated with the virus.
Unsystematic: due to random/unknown factors; within group variance.
Between mice with exactly the same genetic make-up.
Between cells from the same genotype/pup/week/well.
A test statistic (t/F) is usually the ratio between systematic/unsystematic variance.
explained by the model / not explained by the model.
Significant: used to mean that it is unlikely to observe such a large effect/association by
chance alone under the null hypothesis (if, in reality, there is no effect/association).
Sampling theory: if we could collect all data, we wouldn’t need inferential statistics!
We use sample estimates (observed values) to represent population parameters (known/true
values), taking into account the variability inherent in sampling.
Standard error: the SD of sample means.
Take multiple samples from a population.
Calculate the mean of each sample.
Variation in the sample of means is the standard error.
This is not practical to collect such samples, so:
The larger the variation in your population, the larger SE unless your samples are large.
Central limit theorem: if samples are large enough (>30), the sampling distribution is normal
with:
in a distribution of sample means.
Standard error vs. standard deviation:
The SD is the difference between observation and mean; between the true value and
the estimated value (or model). It concerns variation within 1 sample.
The SE is a measure of sampling variation; variation you expect in your sample just
by chance alone. It concerns variation across multiple samples and refers to variation
of a parameter estimate between samples.
The smaller SD or SE, the more homogeneous the population.
Statistical inference: when analyzing data within a sample, you obtain a parameter estimate
(mean, mean difference, association coefficient) and a corresponding measure of sampling
variability (SD, SE). But how does this relate back to the research question?
Probability dense function: the worked out mathematical formula for several common
distributions, like the normal distribution. We plot the value of the variable (x) against the
probability of it occurring (y). The resulting curve is the probability distribution.
4