Faculty of Health, Medicine and Life Sciences
1.1 Week 4
1.1.1 Seminar 4.1 assignments
Don’t forget watching the videos!
All relevant statistical concepts have been discussed earlier, but repeating the
discussion of several concepts is always good. In this seminar regression analysis is
combined with statistical testing and the results of a t-test are compared with that
of a regression analysis.
Problem 1 > see SPPS instructions below!
Consider the following sav-file: ‘Fish.sav’.
A randomized clinical trial has been conducted to analyse the effect of fish consumption
(fish or meat) on bleeding time in minutes. There were 84 volunteers coming from three
different research centers (Maastricht, Tromso and Zeist). Each person was measured
twice: a baseline measurement before the fish/meat treatment (Bt0 in minutes) and a
post measurement 6 weeks after the intervention (Bt6 in minutes).
A comparison is made between eating fish and eating meat (variable Fish) with respect
to the change in bleeding time (Bt6 – Bt0). It was hypothesized (according to theory or
what we want to find out) that the average change in bleeding time of fish eaters differs
from that of the meat eaters.
The question is whether we can confirm this (research hypothesis).
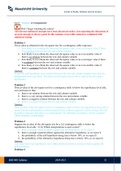
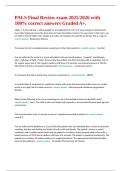
a. Produce a graph of the difference in post-pre measurement bleeding time
(Bt6 – Bt0) against fish and meat eaters and describe what you see.
BBS1003 Syllabus 2020-2021 202020
, Faculty of Health, Medicine and Life Sciences
b. Formulate the null – and alternative hypothesis that is being tested.
H0: f- m = 0
Ha: f - m 0
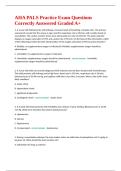
c. Perform the appropriate test for this hypothesis and discuss your conclusion.
Levene’s test shows that F is 5,597 and Sig. is 0.020. Equal variances cannot be
assumed since the p-value (0.020) is smaller than alpha/ level of significance
(0.050). The second line (unpooled/ equal variances not assumed) will be looked
at it. The t-value is -3.183 with p-value equal to 0.002. The null hypothesis will be
rejected since the t-value is negative and the p-value is lower than 0.05
(alpha/significance level).
d. Perform a linear regression analysis of the change in bleeding time on fish/meat
eaters and compare this result with that of c.
The standard error, t-test value and p-value are the same in the linear regression
analysis and in the independent two sample t-test (equal variances assumed).
e. Explain why a two sample t-test (with equal variances) produces the same results
as a linear regression model when the x-variable is dichotomous.
The results will be equal, because the regression slope of a dichotomous X-variable is
equal to the difference in average outcome (total iq) between the two groups as
indicated by the X-variable. This similarity is always the case as long as equal
variances (homoscedasticity) can be assumed.
^
β 1=change ( fish)−change ( meat ) .Note the difference is sign with the output of
independent sample test.
BBS1003 Syllabus 2020-2021 212121
1.1 Week 4
1.1.1 Seminar 4.1 assignments
Don’t forget watching the videos!
All relevant statistical concepts have been discussed earlier, but repeating the
discussion of several concepts is always good. In this seminar regression analysis is
combined with statistical testing and the results of a t-test are compared with that
of a regression analysis.
Problem 1 > see SPPS instructions below!
Consider the following sav-file: ‘Fish.sav’.
A randomized clinical trial has been conducted to analyse the effect of fish consumption
(fish or meat) on bleeding time in minutes. There were 84 volunteers coming from three
different research centers (Maastricht, Tromso and Zeist). Each person was measured
twice: a baseline measurement before the fish/meat treatment (Bt0 in minutes) and a
post measurement 6 weeks after the intervention (Bt6 in minutes).
A comparison is made between eating fish and eating meat (variable Fish) with respect
to the change in bleeding time (Bt6 – Bt0). It was hypothesized (according to theory or
what we want to find out) that the average change in bleeding time of fish eaters differs
from that of the meat eaters.
The question is whether we can confirm this (research hypothesis).
a. Produce a graph of the difference in post-pre measurement bleeding time
(Bt6 – Bt0) against fish and meat eaters and describe what you see.
BBS1003 Syllabus 2020-2021 202020
, Faculty of Health, Medicine and Life Sciences
b. Formulate the null – and alternative hypothesis that is being tested.
H0: f- m = 0
Ha: f - m 0
c. Perform the appropriate test for this hypothesis and discuss your conclusion.
Levene’s test shows that F is 5,597 and Sig. is 0.020. Equal variances cannot be
assumed since the p-value (0.020) is smaller than alpha/ level of significance
(0.050). The second line (unpooled/ equal variances not assumed) will be looked
at it. The t-value is -3.183 with p-value equal to 0.002. The null hypothesis will be
rejected since the t-value is negative and the p-value is lower than 0.05
(alpha/significance level).
d. Perform a linear regression analysis of the change in bleeding time on fish/meat
eaters and compare this result with that of c.
The standard error, t-test value and p-value are the same in the linear regression
analysis and in the independent two sample t-test (equal variances assumed).
e. Explain why a two sample t-test (with equal variances) produces the same results
as a linear regression model when the x-variable is dichotomous.
The results will be equal, because the regression slope of a dichotomous X-variable is
equal to the difference in average outcome (total iq) between the two groups as
indicated by the X-variable. This similarity is always the case as long as equal
variances (homoscedasticity) can be assumed.
^
β 1=change ( fish)−change ( meat ) .Note the difference is sign with the output of
independent sample test.
BBS1003 Syllabus 2020-2021 212121