Wiskunde (B) – Hoofdstuk 3 Asymptoten en limieten
§3.1 Karakteristieken
Als grafiek van functie goed in beeld is, zijn alle karakteristieken zichtbaar, bv:
Snijpunten met assen x-as en y-as
Toppen = Extremen
Top berekenen
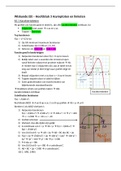
F(x) = -x3+27x+44
1) Op GR minimum/maximum berekenen
2) Coördinaten zijn (3,98) en (-3,-10)
3) Noteren als: f(3) = 98 en f(-3) = -10
Functie goed in beeld krijgen
1) Nulpunten berekenen door f(x) = 0 op te lossen
2) Bekijk tabel voor x-waarden die minstens lopen
vanaf kleinste nulpunt tot grootste nulpunt Als
er minder dan 2 snijpunten zijn, pas je tabel net zo
lang aan totdat je idee krijgt waar grafiek stijgt en
daalt
3) Bepaal snijpunten met y-as door x = 0 op te lossen
4) Toppen bepalen door in tabel te kijken
5) Soms gebruikmaken van transformaties van
bijbehorende standaardfunctie
Bruikbare schets van grafiek maken Alle
karakteristieken zichtbaar Karakteristieken
Coördinaten berekenen
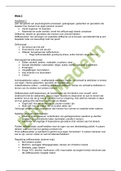
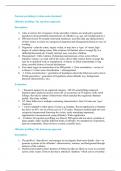
F(x) = √(400-x2)
Rechthoek ABCD A en B op x-as, C en D op grafiek Xb = p p>0
Bereken C als ABCD vierkant is
1) Nulpunten berekenen
f(x) = √(400-x2) √(400-x2) = 0 400-x2 = 0 x2 = 400
x = ±√400 x = 20 v x = -20
2) Grafiek schetsen
3) Vierkant, dus alle zijden zijn gelijk
4) X-coördinaat van C = p Xb = p f(x) = √(400-x2)
f(p) = √(400-p2)
5) Van (0,0) tot B = p AB = 2p AB = BC dus BC = 2p
6) F(p) = 2p √(400-p2) = 2p 400-p2 = (2p)2 400-p2 =
4p2 5p2 = 400 p2 = 80 p = ±√80
7) P>0 dus p = √80
8) Van (0,0) tot B = p = √80 x-coördinaat C
9) AB = BC = 2p = 2√80 y-coördinaat C
10) C: (√80, 2√80)
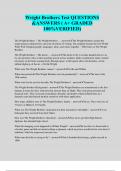
, Bereken C als ABCD zo groot mogelijke oppervlakte heeft,
ABCD is symmetrisch
1) Schets maken
2) Opp = lengte*breedte Opp = AB*BC
AB = 2p
X-coördinaat van C is p y-coördinaat van C is
f(p) = √(400-p2)
Dus opp = 2p*√(400-p2)
3) Plotten in GR en maximum berekenen ≈14,14 = p
4) X-coördinaat van C = p ≈ 14,14 Invullen in f(x) om y-
coördinaat te berekenen f(14,14) = √(400-14,142)
f(14,14) ≈ 14,14 y-coördinaat
5) C: (14,14;14,14)
§3.2 Asymptoten
Asymptoten = Lijnen waar grafiek steeds dichter in de buurt komt als je verder van de
oorsprong af gaat Grafiek snijdt deze lijn nooit!
Verticale asymptoot = v.a. Noemer van breuk gelijkstellen aan 0 x berekenen
Horizontale asymptoot = h.a. Waar grafiek steeds dichter in de buurt komt als x
steeds groter wordt “Als x steeds groter (steeds verder afwijkt van 0), wordt
teller/noemer steeds groter/kleiner (evt. teller/noemer blijft gelijk) en dus komt de
grafiek steeds dichter in de buurt van y = …
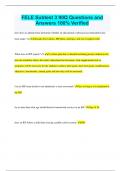
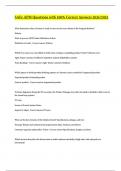
Standaardfunctie f(x) = 1/x
Verticale asymptoot Noemer = 0 x = 0
Horizontale asymptoot Als x steeds groter wordt,
wordt noemer steeds groter, teller blijft gelijk en dus
komt y steeds dichter bij 0 y = 0
Domein Df = < , 0 > U < 0, >
Bereik Bf = < , 0 > U < 0, >
Als grafiek goed in beeld is, zijn alle karakteristieken
zichtbaar:
Snijpunten met assen
Toppen
Asymptoten
Gebroken functie van vorm y = a/x Omgekeerd
evenredig verband tussen y en x xy = a Product
van x en y is altijd gelijk aan a
Breuken
6/2 = 3 Want 2*3 = 6
0/5 = 0 Want 5*0 = 0
6/0 Kan niet, want er bestaat geen getal waarmee je 0 kunt vermenigvuldigen,
zodat 6 de uitkomst is
§3.1 Karakteristieken
Als grafiek van functie goed in beeld is, zijn alle karakteristieken zichtbaar, bv:
Snijpunten met assen x-as en y-as
Toppen = Extremen
Top berekenen
F(x) = -x3+27x+44
1) Op GR minimum/maximum berekenen
2) Coördinaten zijn (3,98) en (-3,-10)
3) Noteren als: f(3) = 98 en f(-3) = -10
Functie goed in beeld krijgen
1) Nulpunten berekenen door f(x) = 0 op te lossen
2) Bekijk tabel voor x-waarden die minstens lopen
vanaf kleinste nulpunt tot grootste nulpunt Als
er minder dan 2 snijpunten zijn, pas je tabel net zo
lang aan totdat je idee krijgt waar grafiek stijgt en
daalt
3) Bepaal snijpunten met y-as door x = 0 op te lossen
4) Toppen bepalen door in tabel te kijken
5) Soms gebruikmaken van transformaties van
bijbehorende standaardfunctie
Bruikbare schets van grafiek maken Alle
karakteristieken zichtbaar Karakteristieken
Coördinaten berekenen
F(x) = √(400-x2)
Rechthoek ABCD A en B op x-as, C en D op grafiek Xb = p p>0
Bereken C als ABCD vierkant is
1) Nulpunten berekenen
f(x) = √(400-x2) √(400-x2) = 0 400-x2 = 0 x2 = 400
x = ±√400 x = 20 v x = -20
2) Grafiek schetsen
3) Vierkant, dus alle zijden zijn gelijk
4) X-coördinaat van C = p Xb = p f(x) = √(400-x2)
f(p) = √(400-p2)
5) Van (0,0) tot B = p AB = 2p AB = BC dus BC = 2p
6) F(p) = 2p √(400-p2) = 2p 400-p2 = (2p)2 400-p2 =
4p2 5p2 = 400 p2 = 80 p = ±√80
7) P>0 dus p = √80
8) Van (0,0) tot B = p = √80 x-coördinaat C
9) AB = BC = 2p = 2√80 y-coördinaat C
10) C: (√80, 2√80)
, Bereken C als ABCD zo groot mogelijke oppervlakte heeft,
ABCD is symmetrisch
1) Schets maken
2) Opp = lengte*breedte Opp = AB*BC
AB = 2p
X-coördinaat van C is p y-coördinaat van C is
f(p) = √(400-p2)
Dus opp = 2p*√(400-p2)
3) Plotten in GR en maximum berekenen ≈14,14 = p
4) X-coördinaat van C = p ≈ 14,14 Invullen in f(x) om y-
coördinaat te berekenen f(14,14) = √(400-14,142)
f(14,14) ≈ 14,14 y-coördinaat
5) C: (14,14;14,14)
§3.2 Asymptoten
Asymptoten = Lijnen waar grafiek steeds dichter in de buurt komt als je verder van de
oorsprong af gaat Grafiek snijdt deze lijn nooit!
Verticale asymptoot = v.a. Noemer van breuk gelijkstellen aan 0 x berekenen
Horizontale asymptoot = h.a. Waar grafiek steeds dichter in de buurt komt als x
steeds groter wordt “Als x steeds groter (steeds verder afwijkt van 0), wordt
teller/noemer steeds groter/kleiner (evt. teller/noemer blijft gelijk) en dus komt de
grafiek steeds dichter in de buurt van y = …
Standaardfunctie f(x) = 1/x
Verticale asymptoot Noemer = 0 x = 0
Horizontale asymptoot Als x steeds groter wordt,
wordt noemer steeds groter, teller blijft gelijk en dus
komt y steeds dichter bij 0 y = 0
Domein Df = < , 0 > U < 0, >
Bereik Bf = < , 0 > U < 0, >
Als grafiek goed in beeld is, zijn alle karakteristieken
zichtbaar:
Snijpunten met assen
Toppen
Asymptoten
Gebroken functie van vorm y = a/x Omgekeerd
evenredig verband tussen y en x xy = a Product
van x en y is altijd gelijk aan a
Breuken
6/2 = 3 Want 2*3 = 6
0/5 = 0 Want 5*0 = 0
6/0 Kan niet, want er bestaat geen getal waarmee je 0 kunt vermenigvuldigen,
zodat 6 de uitkomst is