CORPORATE ANALYSIS OF
EC221 Individual Report
Student number: 19824671
HP INC
Tutor: Rafael Pool
Date 14/03/2021
Words: 1765
1
,Contents
Introduction....................................................................................................................................3
Profitability............................................................................................................................................4
Liquidity.................................................................................................................................................6
Efficiency...............................................................................................................................................8
Gearing ratios.......................................................................................................................................11
References....................................................................................................................................15
Appendices...................................................................................................................................16
Appendix 1: Industry averages......................................................................................................16
Appendix 2:2016-2020 Financial data and Relevant notes....................................................................17
2019-2020 Financial data (Hp inc, 2020)...............................................................................................17
2019-2020 Relevant Notes (Hp inc, 2020).............................................................................................26
2016-2018 Financial data (Hp inc, 2018)...............................................................................................36
Appendix 3: Financial Ratios.........................................................................................................47
Profitability ratios.................................................................................................................................47
Liquidity Ratios.....................................................................................................................................49
.............................................................................................................................................................49
Efficiency Ratios....................................................................................................................................50
Gearing/Risk Ratios..............................................................................................................................52
,Introduction
The following report will provide a basic understanding of how Hewlett Packard (HP) is
financially operating in the consumer electronics industry compared to the industry and its
competitors. It is the 9th best company in consumer electronics in terms of company sales
(Passport, 2020). It will include financial ratio calculations for the last four years to give
investors a more transparent view of the industry. The industry averages are conducted from
other competitors such as Apple, Samsung, and Microsoft.
, Profitability
Profitability ratios give an evaluation of the overall performance of a company and how
efficiently it can generate or manage its profits (Goel, 2016).
Gross Profit margin is used to assess a company’s wealth by subtracting the cost of sales from
revenue (McKenzie, Webdy, p 354)
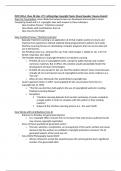
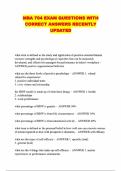
Gross profit margin in % over the last 4 years
50
45
40
35
30
25
20
15
10
5
0
2016 2017 2018 2019 2020
HP industry
Figure 1: Gross profit margin in % over the last 4 years
HP’s gross profit margin has been significantly lower than the industry average. There are
numerous reasons to explain this. Hp focus on printers and notebook sales which have lower
margins than other products in the sector e.g. smartphones. Higher margins in a fast-changing
sector like smartphones because the product life cycle is shorter and R&D costs must be
recovered more quickly; conversely printer sector is less innovative and a longer life cycle.
Portable consumer electronics are the biggest segment within the consumer electronics
industry and have a bigger profit margin. Computer and Peripherals are valued at 95,150.80 US
dollars whilst portable consumer electronics are valued at 271,325.20 US dollars. (Passport
2020).
Secondly, while many other companies focus on branching out to other areas such as
smartphones and home entertainment. Hp focus on dominating their segment and
consequently their gross profit margins are lower than the consumer electronics industry
average (Passport 2020). Their personal systems are their most profitable segment. Between
2018-2020, the net revenue increased by 0.8% because of the growth of Notebooks which was
EC221 Individual Report
Student number: 19824671
HP INC
Tutor: Rafael Pool
Date 14/03/2021
Words: 1765
1
,Contents
Introduction....................................................................................................................................3
Profitability............................................................................................................................................4
Liquidity.................................................................................................................................................6
Efficiency...............................................................................................................................................8
Gearing ratios.......................................................................................................................................11
References....................................................................................................................................15
Appendices...................................................................................................................................16
Appendix 1: Industry averages......................................................................................................16
Appendix 2:2016-2020 Financial data and Relevant notes....................................................................17
2019-2020 Financial data (Hp inc, 2020)...............................................................................................17
2019-2020 Relevant Notes (Hp inc, 2020).............................................................................................26
2016-2018 Financial data (Hp inc, 2018)...............................................................................................36
Appendix 3: Financial Ratios.........................................................................................................47
Profitability ratios.................................................................................................................................47
Liquidity Ratios.....................................................................................................................................49
.............................................................................................................................................................49
Efficiency Ratios....................................................................................................................................50
Gearing/Risk Ratios..............................................................................................................................52
,Introduction
The following report will provide a basic understanding of how Hewlett Packard (HP) is
financially operating in the consumer electronics industry compared to the industry and its
competitors. It is the 9th best company in consumer electronics in terms of company sales
(Passport, 2020). It will include financial ratio calculations for the last four years to give
investors a more transparent view of the industry. The industry averages are conducted from
other competitors such as Apple, Samsung, and Microsoft.
, Profitability
Profitability ratios give an evaluation of the overall performance of a company and how
efficiently it can generate or manage its profits (Goel, 2016).
Gross Profit margin is used to assess a company’s wealth by subtracting the cost of sales from
revenue (McKenzie, Webdy, p 354)
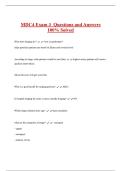
Gross profit margin in % over the last 4 years
50
45
40
35
30
25
20
15
10
5
0
2016 2017 2018 2019 2020
HP industry
Figure 1: Gross profit margin in % over the last 4 years
HP’s gross profit margin has been significantly lower than the industry average. There are
numerous reasons to explain this. Hp focus on printers and notebook sales which have lower
margins than other products in the sector e.g. smartphones. Higher margins in a fast-changing
sector like smartphones because the product life cycle is shorter and R&D costs must be
recovered more quickly; conversely printer sector is less innovative and a longer life cycle.
Portable consumer electronics are the biggest segment within the consumer electronics
industry and have a bigger profit margin. Computer and Peripherals are valued at 95,150.80 US
dollars whilst portable consumer electronics are valued at 271,325.20 US dollars. (Passport
2020).
Secondly, while many other companies focus on branching out to other areas such as
smartphones and home entertainment. Hp focus on dominating their segment and
consequently their gross profit margins are lower than the consumer electronics industry
average (Passport 2020). Their personal systems are their most profitable segment. Between
2018-2020, the net revenue increased by 0.8% because of the growth of Notebooks which was