Who uses the financial statements of a
company?
• The shareholders
• Their main concern is the profit of the company and whether the trend in profits is sufficient to sus
the dividends and earnings that they would expect
• Potential shareholders
• They want to know whether or not they should buy shares
• Directors
• They use the financial statements to make decisions. They are concerned about the company’s pub
image.
• Auditors
• They owe the shareholders an honest opinion on the annual financial statements
• Companies and Intellectual Properties Commission
• They check that the annual financial statements meet the requirements. They have the power to for
companies to close if they are not operating or recording as they should.
micks19
, Who uses the financial statements of a
company?
• Financial Institutions
• They look at the annual financial statements of the company when they apply for a loan
• Creditors who grant short-term credit
• They look at the liquidity of the company before granting credit to ensure that they will be able to p
• Employees and their representative Trade Unions
• The employees look at the financial statements to see whether or not they are being paid reasonabl
whether or not they have job security
• SARS
• SARS checks that the amount of Income Tax paid is correct. They want as much as possible
• Competitors
• The competitors use the financial statements to compare to their own results
• The Financial Press
• They perform a service for their subscribers by analysing the results of the financial statements
especially those of companies on the JSE. This provides the subscribers with information relevant to
their investment decisions.
micks19
, Interpret indicators by comparing to…
• The results from previous years. Has there been growth or stagnation?
• The results of competitors
• Alternative investments. Should they have invested elsewhere instead?
• A desired aim or objective
• The generally accepted norms and standards
• The general economic indicators
micks19
, Uses of the indicators
• Determine the degree of financial risk by investors/creditors
• Enable comparison of the performance of the company
• In different years
• With its budgets and forecasts
• With other companies in similar trades (competitors)
• Check whether there is growth or stagnation
• Provide information of the company in respect of the liquidity, profitability, use of assets and
capital structure
• Comparison can be provided by eliminating the effects of the scale and size of different
companies or different years of the same company
• Assist in future planning of the business
micks19
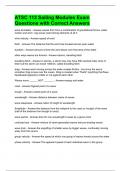
, Financial
indicators
Liquidity (the Solvency (the Risk/Gearing Return (what
Profitability (how
ability to pay ability to pay all (degree of owners are
profitable)
current debts) debt) financial risk) getting back)
Return on capital
Gross profit on Debt/Equity
Current ratio Solvency ratio employed
sales Ratio
(ROCE)
Notes: Return on
Gross profit on
Acid-test ratio • For all “Sales” deduct shareholders
cost of sales
Debtors Allowances if equity
it is given
Operating • For the ratios
Stock turnover Earnings per
expenses on
rate involving days (365), share
sales check if it is a leap
year
• Working Capital is Net
Operating Stock holding Dividends per
income on sales period Current Assets, i.e. share
Current Assets –
Current Liabilities
Net profit after Debtors average • Net Assets is Equity Net asset value
tax on turnover collection period (Assets – Liabilities) per share
Creditors
average payment
period micks19
, Gross Profit on Sales
• Gross profit margin – mark-up on selling price
• Norm is dependent on the type of business
• Indicates the percentage by which the total sellin
price is greater than the cost price
𝐺𝑟𝑜𝑠𝑠 𝑃𝑟𝑜𝑓𝑖𝑡 • An increase is desirable – it indicates a lower cos
× 100 sales
𝑆𝑎𝑙𝑒𝑠 • A low percentage indicates that the business wil
be able to meet all expenses
• Causes for a decrease:
• Pressure on selling price as a result of competition
• Upward pressure on costs as a result of inflation o
other cost factors
• Reduced selling prices
micks19
, Gross Profit on Cost of Sales
• Determines the mark-up achieved
• An increase is desirable
• The norm is dependent on the type of business
𝐺𝑟𝑜𝑠𝑠 𝑃𝑟𝑜𝑓𝑖𝑡 • Problematic if the achieved mark-up is much lowe
× 100 than the intended mark-up
𝐶𝑜𝑠𝑡 𝑜𝑓 𝑆𝑎𝑙𝑒𝑠 • Causes for an increase:
• Better prices offered by suppliers
• Causes for a decrease:
• Theft
• Too many discounts
• Mistakes on marked prices of goods (or in the
books)
• Seasonal sales
micks19
company?
• The shareholders
• Their main concern is the profit of the company and whether the trend in profits is sufficient to sus
the dividends and earnings that they would expect
• Potential shareholders
• They want to know whether or not they should buy shares
• Directors
• They use the financial statements to make decisions. They are concerned about the company’s pub
image.
• Auditors
• They owe the shareholders an honest opinion on the annual financial statements
• Companies and Intellectual Properties Commission
• They check that the annual financial statements meet the requirements. They have the power to for
companies to close if they are not operating or recording as they should.
micks19
, Who uses the financial statements of a
company?
• Financial Institutions
• They look at the annual financial statements of the company when they apply for a loan
• Creditors who grant short-term credit
• They look at the liquidity of the company before granting credit to ensure that they will be able to p
• Employees and their representative Trade Unions
• The employees look at the financial statements to see whether or not they are being paid reasonabl
whether or not they have job security
• SARS
• SARS checks that the amount of Income Tax paid is correct. They want as much as possible
• Competitors
• The competitors use the financial statements to compare to their own results
• The Financial Press
• They perform a service for their subscribers by analysing the results of the financial statements
especially those of companies on the JSE. This provides the subscribers with information relevant to
their investment decisions.
micks19
, Interpret indicators by comparing to…
• The results from previous years. Has there been growth or stagnation?
• The results of competitors
• Alternative investments. Should they have invested elsewhere instead?
• A desired aim or objective
• The generally accepted norms and standards
• The general economic indicators
micks19
, Uses of the indicators
• Determine the degree of financial risk by investors/creditors
• Enable comparison of the performance of the company
• In different years
• With its budgets and forecasts
• With other companies in similar trades (competitors)
• Check whether there is growth or stagnation
• Provide information of the company in respect of the liquidity, profitability, use of assets and
capital structure
• Comparison can be provided by eliminating the effects of the scale and size of different
companies or different years of the same company
• Assist in future planning of the business
micks19
, Financial
indicators
Liquidity (the Solvency (the Risk/Gearing Return (what
Profitability (how
ability to pay ability to pay all (degree of owners are
profitable)
current debts) debt) financial risk) getting back)
Return on capital
Gross profit on Debt/Equity
Current ratio Solvency ratio employed
sales Ratio
(ROCE)
Notes: Return on
Gross profit on
Acid-test ratio • For all “Sales” deduct shareholders
cost of sales
Debtors Allowances if equity
it is given
Operating • For the ratios
Stock turnover Earnings per
expenses on
rate involving days (365), share
sales check if it is a leap
year
• Working Capital is Net
Operating Stock holding Dividends per
income on sales period Current Assets, i.e. share
Current Assets –
Current Liabilities
Net profit after Debtors average • Net Assets is Equity Net asset value
tax on turnover collection period (Assets – Liabilities) per share
Creditors
average payment
period micks19
, Gross Profit on Sales
• Gross profit margin – mark-up on selling price
• Norm is dependent on the type of business
• Indicates the percentage by which the total sellin
price is greater than the cost price
𝐺𝑟𝑜𝑠𝑠 𝑃𝑟𝑜𝑓𝑖𝑡 • An increase is desirable – it indicates a lower cos
× 100 sales
𝑆𝑎𝑙𝑒𝑠 • A low percentage indicates that the business wil
be able to meet all expenses
• Causes for a decrease:
• Pressure on selling price as a result of competition
• Upward pressure on costs as a result of inflation o
other cost factors
• Reduced selling prices
micks19
, Gross Profit on Cost of Sales
• Determines the mark-up achieved
• An increase is desirable
• The norm is dependent on the type of business
𝐺𝑟𝑜𝑠𝑠 𝑃𝑟𝑜𝑓𝑖𝑡 • Problematic if the achieved mark-up is much lowe
× 100 than the intended mark-up
𝐶𝑜𝑠𝑡 𝑜𝑓 𝑆𝑎𝑙𝑒𝑠 • Causes for an increase:
• Better prices offered by suppliers
• Causes for a decrease:
• Theft
• Too many discounts
• Mistakes on marked prices of goods (or in the
books)
• Seasonal sales
micks19