University of Toronto Scarborough
STAB22 Final Examination
August 2007
This examination is multiple choice. Ensure that you
have a Scantron answer sheet and a #2 pencil, and com-
plete the Scantron sheet according to the instructions
(otherwise your exam may not be marked).
For this examination, you are allowed two letter-sized
sheet of notes (both sides), handwritten and prepared
by you, a non-programmable, non-communicating
calculator, and writing implements.
Mark the answer that is most nearly correct from the
alternatives given.
If you need paper for rough work, use the back of the
sheets of this question paper. The question paper will be
collected at the end of the examination, but any writing
on it will not be read or marked.
This examination has xx numbered pages; before you
start, check to see that you have all the pages.
1
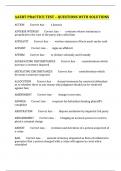
,1. Educational data was recorded for 78 grade 7 students. For the students’ IQ, a boxplot
was drawn, as shown below.
What is the interquartile range?
(a) 64
(b) 50
(c) * 15
(d) 7.5
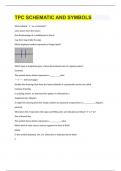
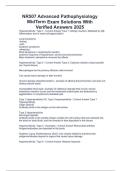
2. For the same students as in Question 1, each student was assessed on the Piers-Harris
Children’s Self-Concept Scale, a psychological test. A histogram of the self-concept
scores is shown below.
Describe the shape of this distribution of scores.
(a) approximately symmetric
(b) skewed to the right
2
, (c) * skewed to the left
(d) cannot tell shape from a histogram
3. Look again at the histogram in Question 2. How do the mean and median compare
for this data set?
(a) * The median is bigger than the mean.
(b) The mean is bigger than the median.
(c) The mean and median are about the same.
(d) It is impossible to compare the mean and median using this histogram.
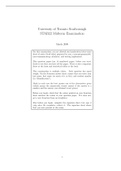
4. As part of an experiment, two groups of data were collected: for treatment A and
treatment B. Boxplots for the two data distributions of the response variable are shown
below.
The researcher wants to compare the mean response value for the two groups. Which
of the statements below best describes the situation?
(a) the means for the two groups are about the same.
(b) * boxplots do not show means, so we cannot reasonably compare the groups.
(c) the mean for group A is bigger.
(d) the mean for group B is bigger.
5. Calorie contents of a number of different hot dogs were measured. Summary statistics
for the calorie content of 20 beef hot dogs are as shown below:
Descriptive Statistics: Beef calories
Variable N N* Mean SE Mean StDev Minimum Q1 Median Q3
Beef calories 20 0 156.85 5.06 22.64 111.00 139.50 152.50 179.75
3
STAB22 Final Examination
August 2007
This examination is multiple choice. Ensure that you
have a Scantron answer sheet and a #2 pencil, and com-
plete the Scantron sheet according to the instructions
(otherwise your exam may not be marked).
For this examination, you are allowed two letter-sized
sheet of notes (both sides), handwritten and prepared
by you, a non-programmable, non-communicating
calculator, and writing implements.
Mark the answer that is most nearly correct from the
alternatives given.
If you need paper for rough work, use the back of the
sheets of this question paper. The question paper will be
collected at the end of the examination, but any writing
on it will not be read or marked.
This examination has xx numbered pages; before you
start, check to see that you have all the pages.
1
,1. Educational data was recorded for 78 grade 7 students. For the students’ IQ, a boxplot
was drawn, as shown below.
What is the interquartile range?
(a) 64
(b) 50
(c) * 15
(d) 7.5
2. For the same students as in Question 1, each student was assessed on the Piers-Harris
Children’s Self-Concept Scale, a psychological test. A histogram of the self-concept
scores is shown below.
Describe the shape of this distribution of scores.
(a) approximately symmetric
(b) skewed to the right
2
, (c) * skewed to the left
(d) cannot tell shape from a histogram
3. Look again at the histogram in Question 2. How do the mean and median compare
for this data set?
(a) * The median is bigger than the mean.
(b) The mean is bigger than the median.
(c) The mean and median are about the same.
(d) It is impossible to compare the mean and median using this histogram.
4. As part of an experiment, two groups of data were collected: for treatment A and
treatment B. Boxplots for the two data distributions of the response variable are shown
below.
The researcher wants to compare the mean response value for the two groups. Which
of the statements below best describes the situation?
(a) the means for the two groups are about the same.
(b) * boxplots do not show means, so we cannot reasonably compare the groups.
(c) the mean for group A is bigger.
(d) the mean for group B is bigger.
5. Calorie contents of a number of different hot dogs were measured. Summary statistics
for the calorie content of 20 beef hot dogs are as shown below:
Descriptive Statistics: Beef calories
Variable N N* Mean SE Mean StDev Minimum Q1 Median Q3
Beef calories 20 0 156.85 5.06 22.64 111.00 139.50 152.50 179.75
3