Materials & Methods
For a more detailed protocol, consult the lab journal of week 2.
Starting material was made for all experiments; an Eppendorf tube was filled with 250 µl water and a
single colony was picked from a blood agar plate. This colony was used for all subsequent
experiments to ensure cells with the same genetics.
Determine bacterial species by specific medium
Two different plates were marked: one with brain heart infusion
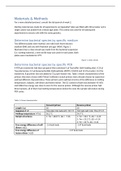
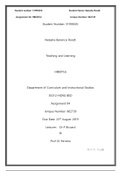
medium (BHI) and one with Mannitol salt agar (MSA). Figure 1
illustrates how a clean streak was made from the bacterial suspension
(i.e. starting material), a new sterile loop was used for each plate. Both
plates were incubated at 37°C.
Figure 1: Clean streak.
Determine bacterial species by specific PCR
A PCR pre-mastermix had been prepared that contained 5 μl Taq buffer (with loading dye), 0.25 μl
Taq polymerase, 0.5 μl deoxynucleotide triphosphates (dNTPs; 10mM) and 12.25 μl water. For the
mastermix, 8 μl primer mix was added to 72 μl pre-master mix. Table 1 shows characteristics of the
primers that were chosen with Primer3 software (actual primers were already chosen by supervisor
and had different characteristics). These primers were optimal in terms of the difference in melting
temperature, hairpins, self-dimer and hetero-dimer. The GC content of both was between 45-50%
and Gibbs free energy was close to zero for the reverse primer. Although the reverse primer had
three hairpins, all of them had melting temperatures below the ones the sample will endure during
PCR cycles.
Table 1: Primer characteristics
Forward primer Reverse primer
Length (bp) 20 20
Sequence 5’-3’ TGA GAC CGC AAG GTC TCT TT TGT GAC AAT CGC TTG CTT CT
Melting temperature (=Tm) 56.2 oC 54.9 oC
Hairpin structures 1: Tm = 68.8 oC, ΔG = -7.36 1: Tm = 30.1 oC, ΔG = -0.43
2: Tm = 23.3 oC, ΔG = 0.14
3: Tm = 20 oC, ΔG = 0.42
Free energy difference of self- -1.6 kcal/mole -1.47 kcal/mole
dimer (=ΔG)
Free energy difference of -1.57 kcal/mole
hetero-dimer (=ΔG)
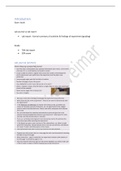
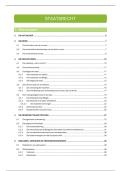
, Table 2 demonstrates the pipetting scheme of
PCR samples. All samples were left on ice until
transferred to the PCR machine and cycled
according to figure 2.
Figure 2: PCR cycling program
Table 2 Pipetting scheme of PCR samples. Including positive control (+) and negative control (-)
Sample 1 (bacterial suspension) 2 (+) 3 (-)
Content 5 μl bacterial suspension 5 μl S. aureus DNA 5 μl non template
control (NTC)
PCR mastermix 20 μl 20 μl 20 μl
After PCR, 3.5 μl SYBR dye was added to all samples. A prepared agarose gel (1.5%) was put in the
electrophoresis device with Tris-acetate-EDTA (TAE) buffer. 15 μl of all three samples was loaded
onto the gel next to 7 μl molecular ladder. The gel could then be run at 80V for 30 minutes and
subsequently placed in a transilluminator.
Finally, a BLAST (Basic Local Alignment Search Tool) was done with the sequence of the chosen
primers and the sequence obtained by PCR.
Correlation of CFU & OD
First, 10 ml of BHI medium was added to a Greiner tube together with remaining bacterial culture
suspension (i.e. starting material). A negative control with only BHI medium was also used and the
tubes were put in a shaking incubator at 37°C (150 rpm) overnight.
First, a cuvette was filled with 1 ml BHI medium to blank the spectrophotometer. The OD 600 could
then be determined with 1 ml of overnight culture. The sample was diluted two times because 0.1 >
OD600 > 1. Lastly, the sample was diluted 1.81 times to get an OD 600 of 0.6.
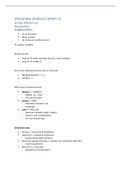
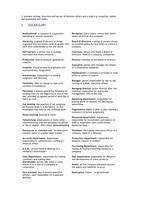
The remaining sample was then used as
‘’undiluted’’ sample in a dilution series
illustrated by figure 3. The dilutions were
prepared in Eppendorf tubes before pipetting
100 μl of sample into the middle of five petri
dishes (10-4, 10-5, 10-6, 10-7, 10-8). The samples
were spread with a broad spreader and
incubated upside down overnight at 37°C.
The number of colonies could now be counted
on plates with 0-200 colonies to determine the Figure 3: Dilution series
colony forming units (CFU).
Determine MIC
For a more detailed protocol, consult the lab journal of week 2.
Starting material was made for all experiments; an Eppendorf tube was filled with 250 µl water and a
single colony was picked from a blood agar plate. This colony was used for all subsequent
experiments to ensure cells with the same genetics.
Determine bacterial species by specific medium
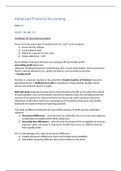
Two different plates were marked: one with brain heart infusion
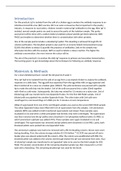
medium (BHI) and one with Mannitol salt agar (MSA). Figure 1
illustrates how a clean streak was made from the bacterial suspension
(i.e. starting material), a new sterile loop was used for each plate. Both
plates were incubated at 37°C.
Figure 1: Clean streak.
Determine bacterial species by specific PCR
A PCR pre-mastermix had been prepared that contained 5 μl Taq buffer (with loading dye), 0.25 μl
Taq polymerase, 0.5 μl deoxynucleotide triphosphates (dNTPs; 10mM) and 12.25 μl water. For the
mastermix, 8 μl primer mix was added to 72 μl pre-master mix. Table 1 shows characteristics of the
primers that were chosen with Primer3 software (actual primers were already chosen by supervisor
and had different characteristics). These primers were optimal in terms of the difference in melting
temperature, hairpins, self-dimer and hetero-dimer. The GC content of both was between 45-50%
and Gibbs free energy was close to zero for the reverse primer. Although the reverse primer had
three hairpins, all of them had melting temperatures below the ones the sample will endure during
PCR cycles.
Table 1: Primer characteristics
Forward primer Reverse primer
Length (bp) 20 20
Sequence 5’-3’ TGA GAC CGC AAG GTC TCT TT TGT GAC AAT CGC TTG CTT CT
Melting temperature (=Tm) 56.2 oC 54.9 oC
Hairpin structures 1: Tm = 68.8 oC, ΔG = -7.36 1: Tm = 30.1 oC, ΔG = -0.43
2: Tm = 23.3 oC, ΔG = 0.14
3: Tm = 20 oC, ΔG = 0.42
Free energy difference of self- -1.6 kcal/mole -1.47 kcal/mole
dimer (=ΔG)
Free energy difference of -1.57 kcal/mole
hetero-dimer (=ΔG)
, Table 2 demonstrates the pipetting scheme of
PCR samples. All samples were left on ice until
transferred to the PCR machine and cycled
according to figure 2.
Figure 2: PCR cycling program
Table 2 Pipetting scheme of PCR samples. Including positive control (+) and negative control (-)
Sample 1 (bacterial suspension) 2 (+) 3 (-)
Content 5 μl bacterial suspension 5 μl S. aureus DNA 5 μl non template
control (NTC)
PCR mastermix 20 μl 20 μl 20 μl
After PCR, 3.5 μl SYBR dye was added to all samples. A prepared agarose gel (1.5%) was put in the
electrophoresis device with Tris-acetate-EDTA (TAE) buffer. 15 μl of all three samples was loaded
onto the gel next to 7 μl molecular ladder. The gel could then be run at 80V for 30 minutes and
subsequently placed in a transilluminator.
Finally, a BLAST (Basic Local Alignment Search Tool) was done with the sequence of the chosen
primers and the sequence obtained by PCR.
Correlation of CFU & OD
First, 10 ml of BHI medium was added to a Greiner tube together with remaining bacterial culture
suspension (i.e. starting material). A negative control with only BHI medium was also used and the
tubes were put in a shaking incubator at 37°C (150 rpm) overnight.
First, a cuvette was filled with 1 ml BHI medium to blank the spectrophotometer. The OD 600 could
then be determined with 1 ml of overnight culture. The sample was diluted two times because 0.1 >
OD600 > 1. Lastly, the sample was diluted 1.81 times to get an OD 600 of 0.6.
The remaining sample was then used as
‘’undiluted’’ sample in a dilution series
illustrated by figure 3. The dilutions were
prepared in Eppendorf tubes before pipetting
100 μl of sample into the middle of five petri
dishes (10-4, 10-5, 10-6, 10-7, 10-8). The samples
were spread with a broad spreader and
incubated upside down overnight at 37°C.
The number of colonies could now be counted
on plates with 0-200 colonies to determine the Figure 3: Dilution series
colony forming units (CFU).
Determine MIC