WGU D029 - Population Health Data Brief -Lane County, Oregon
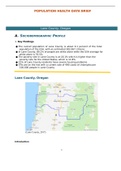
POPULATION HEALTH DATA BRIEF A. SOCIODEMOGRAPHIC PROFILE 1. Key Findings ● The overall population of Lane County is about 0.1 percent of the total population of the USA, with an est imated 382,067 citizens. ● In Lane County, 89.1% of people are white alone while the USA average for white alone is 76.5%. ● The poverty rate in Lane County is at 18.1% which is higher than the poverty rate for the United States, which is 11.8%. ● 22% of Lane County residents have severe housing problems. ● STIs are on the rise with a current rate of 490 cases of chlamydia per 100,000 people in Lane County. Lane County, Oregon (Lane County, 2017) Introduction The United States Census Bureau provides a wide variety of information about population characteristics in each county, state, and overall nation. Information was gathered from the United States Census Bureau website to summarize sociodemographic characteristics in Lane County, Oregon in comparison with the United States (USA). The overall population of Lane County is about 0.1 percent of the total population of the USA, with an estimated 382,067 citizens in the county versus 328,239,523 citizens in the USA. The population percent change in Lane County of 8.6 percent is higher than that of the USA, which is only 6.3 percent. This means the local population in Lane County is growing faster than the overall national population. The percentage of people under the age of 18 in the USA is larger than in Lane County, with the national average being 22.4 percent and the county average being 18.4 percent. However, the percentage of people over the age of 65 in Lane County is 19.3 percent which is higher than the national average of 16 percent. This indicates that the average age of residents in Lane County is likely higher than that of the overall nation. The percentage of women in Lane County is the same as the percentage in the USA, 50.8 percent which is just a tad over half of the total population being female. Ethnic distribution in Lane County is far less varied than the diversity in the USA overall. In Lane County, 89.1 percent of people are white alone while the measure for white alone in the USA is 76.5 percent. The population of Hispanic alone in the county is 9.1 percent which is lower than the national population of 18.3 percent. The percentage of foreign born people in Lane County, 6 percent, is less than half the percentage of foreign born people in the USA overall, 13.5 percent. The percentage of those over the age of five that speak another language besides English at home in Lane County is very low, 8.5 percent, compared to the national measure of 21.5 percent. The percentages of homes with a computer is higher in Lane County, 92.2 percent, than the USA measure of 88.8 percent. Similarly, those with a high school graduate degree or higher is higher in Lane County at 91.4 percent than the national measure of 87.7 percent. The percentage of those with a disability under the age of 65 is higher in Lane County than the USA, 12.4 percent and 8.6 percent respectively. The percentage of those without health insurance under the age of 65, 9.4 percent is only slightly lower than the national percentage of 10 percent. The percentage of those over the age of 16 in the civilian labor force is slightly lower in Lane County, 59.4 percent than the USA average of 62.9 percent. For women, the percent of females over 16 in the labor force in Lane County, 55.9 percent is also slightly lower than the USA average of 58.2 percent. In Lane County, the total healthcare and social assistance revenue is $2,247,351 as compared to the USA, $2,040,441,203. The total retail sales per capita in Lane County is 4,291,512 as compared to the USA, 4,219,821,871. The per capita income in the past 12 months in Lane County of $28,070 is slightly lower than the national average of $32,621. Poverty in Lane County is also higher at 18.1 percent versus the USA measure of 11.8 percent. The population is less dense in Lane County with 77.2 people per square mile as compared to the USA population density of 87.4 people per square mile. Sociodemographic Profile Table Population Characteristics County United States Population Estimates 382,067 328,239,523 Population Percent Change 8.6% 6.3% Percentage of Persons Under the Age of 18 18.4% 22.4% Percentage of Persons 65 Years and Over 19.3% 16.0% Percentage of Women 50.8% 50.8% Percentage White Alone 89.1% 76.5% Percentage Hispanic Alone 9.1% 18.3% Percentage of Foreign-Born Persons 6.0% 13.5% Percentage Language Other Than English Spoken at Home, Percent of Persons Age 5+ 8.5% 21.5% Percentage of Houses with a Computer 92.2% 88.8% Percentage with High School Graduate or Higher 91.4% 87.7% Percentage with a Disability, Under Age 65 Years 12.4% 8.6% Percentage without Health Insurance, Under Age 65 Years 9.4% 10.0% Percentage in Civilian Labor Force Age 16 Years+ 59.4% 62.9% Percentage of Women in Labor Force Age 16 Years+ 55.9% 58.2% Total Healthcare and Social Assistance Revenue 2,247,351 2,040,441,2 03 Total Retail Sales Per Capita 4,291,512 4,219,821,8 71 Per Capita Income in the Past 12 Months $28,070 $32,621 Percentage of Persons in Poverty 18.1% 11.8% Population Per Square Mile 77.2 87.4 B. COUNTY HEALTH TRENDS & RANKINGS Introduction Examining health trends is incredibly valuable to recognize and analyze health disparities in specific groups of people. The Center for Disease Control and Prevention (CDC) created the Healthy People 2020 initiative to promote a society where all people live long, health lives. By examining metrics and data from a specific population, patterns can be recognized and targeted for improvement. For example, if data from a certain county displays that the counties obesity rates are far higher than the national average, this can launch a local initiative for weight management programs, healthy eating education, increased access to physical activity, and more in that area. With knowledge of data and trends, areas for improvement can be easily recognized and targeted. Data for Lane County, Oregon was collected from the University of Wisconsin Population Health Institute School of Medicine and Public Health county health rankings website in order to analyze and compare data on county demographics, health outcomes, quality of life, health factors, social and economic factors, and the physical environment. This data was also compared to the state of Oregon and top United States performers in each category. Seven specific health trends were examined closely to see if Lane County was improving, staying the same, or getting worse for that measure. Discussion of Health Trends Trend graphs are particularly helpful to visualize changes over a period of time, these also give viewers the opportunity to see data plotted and compared. For example, the graphs shown below have the county, state, and national trends in different line patterns so they can be easily differentiated and compared. A visual representation can be much simpler than looking at raw data or reading percentages, and gives a broad picture view of if health trends are improving or getting worse. Lane County, Oregon, is ranked 16th out of the 35 counties in Oregon. The length of life ranking comes from the number of premature deaths, which is years of life lost before age 75 per 100,000 population. The number of premature deaths is 6,300 as compared to 6,000 for the state and 5,500 for the top USA performers. The average life expectancy in Lane County is 79.4 years old which is similar to the state life expectancy of 79.8 years and slightly lower than the top USA performers life expectancy age of 81.1 years. In Lane County, 15 percent of people reported poor or fair health as compared to the state where 17 percent of people reported this, and the top USA performers where only 12 percent of people reported this. Additionally, 15 percent of people reported frequent mental distress as compared to the state where 13 percent report this and in top USA performers only 11 percent of people reported this. The first health trend in figure one, is adult obesity in Lane County which shows that the overall percentage of adults who are obese in Lane County is 27 percent, this is slightly better than the state level of 29 percent and close to the top US performers who are at 26 percent adult obesity rates. However, this graph shows that Lane County is getting worse for this metric. From 2004 to 2014, Lane County has gone from 24 percent adult obesity rates to 27 percent obesity rates which is a 3 percent increase over the last decade. The state of Oregon obesity rates have increased by 4 percent and the USA rates have increased by 4 percent as well. The next health trend depicted in figure three, is the rate of sexually transmitted infections in Lane County. This metric uses chlamydia cases per 100,000 population to measure rates. Lane County is also getting worse for this measure, as cases have nearly doubled over a decade. In 2007, Lane County had 251 cases per 100,000 people and in 2017 had 490 cases per 100,000 people. Though Lane County still measures better than the USA measure of 525 cases per 100,000 people, it is below the measure for the state of Oregon which is only 450 cases per 100,000 people. In figure three, the graph presents physical inactivity trends at the county, state, and national levels. Lane County did not significantly change its measure for this health marker between 2004 and 2014. In 2004, 18 percent of the population was physically inactive and in 2014 this was still the case. Lane County is doing better in this health metric than the USA who measures 23 percent of the population as physically inactive. Figure four shows trends for alcohol-impaired driving death rates in the county, state, and USA. Lane County is on par with the state of Oregon for this health measure, both at 31 percent of driving deaths have alcohol involvement. However, compared to the top USA performers measure of 11 percent, they are not doing well. For this measure, Lane County goes up and down every year in the percentage of driving deaths with alcohol involvement. Overall, Lane County is getting better for this measure. From 2008 to 2009, there was a 15 percent drop in the percent of driving deaths with alcohol involvement. Then the rates rose by 11 percent in 2010 and dropped by 2011 by 19 percent. The measure stayed at 22 percent of driving deaths with alcohol involvement through 2012, but rose again in 2013 by 11 percent. In 2014, the trend dropped back to 22 percent. In 2015, rates doubled to 44 percent and in 2016 began dropping again, to 28 percent and then in 2017 to an all-time low for the county, of 13 percent. Unfortunately, rates rose again in 2018 to 31 percent but overall, there is improvement for this health measure because the percentage of driving deaths with alcohol involvement is trending downward. Figure five shows flu vaccination rates in Lane County. Lane County is doing better than Oregon and USA measures for the percentage of Medicare enrollees that receive vaccines. Lane County has 49 percent of enrollees receiving flu vaccines while Oregon and the USA measure 43 percent. From 2012 to 2017, there has not been much significant change in the percentage of people receiving flu vaccines. Figure six depicts trends for the percent of children living in poverty comparing county, state, and USA measures. Lane County has been getting worse for this measure. From 2002 to 2010, measures for the percent of children in poverty stayed fairly similar at about 17-18 percent, and in 2010 began rising and in 2018 is at 22 percent. This measure is worse than the state measure of only 16 percent of children in poverty and the USA measure of 18 percent of children in poverty. Figure seven shows the trends for air pollution at county, state, and USA levels. This measure is done by comparing the average density of fine particulate matter in micrograms per cubic meter, with higher density indicating worse air pollution. Lane County is improving in this measure. In 2002, the county measured 15 micrograms per cubic meter of fine particulate matter which was worse than the US measure of 11 and the state measure of 9. From 2002 to 2014, this measure decreased to 10, which is closer to the US measure of 9 and the state measure of 8. Health Trends (Visual Graphs) Figure 1 Adult Obesity in Lane County, Oregon Figure 1. Obesity trend over time, comparing the county, state, and national rates. This graph indicates an increase in county adult obesity rates from 2004 to 2016 of 3% as compared to a 4% increase in the state of Oregon and a 4% increase nationally. Figure 2 Sexually Transmitted Infections in Lane County, Oregon Figure 2. STI trends over time, comparing the county, state, and national rates for chlamydia (per 100,000 population). This graph indicates an increase in county STI rates from 2007 to 2017 of 239 cases per 100,000 people as compared to a 184 cases per 100,000 people increase in the state of Oregon and a 155 cases per 100,000 people increase nationally. Figure 3 Physical Inactivity in Lane County, Oregon Figure 3. Physical activity trend over time, comparing the county, state, and national rates. This graph indicates no significant changes in county physical inactivity rates from 2004 to 2016, no significant changes to the state of Oregon rates, and a slight decrease for the national inactivity rates (1%). Figure 4 Alcohol-Impaired Driving Deaths in Lane County, Oregon Figure 4. Alcohol Impaired Driving death rate trend over time, comparing the county, state, and national rates. This graph indicates many changes in Lane county between 2008 and 2018 with an overall decrease of alcohol impaired driving deaths of 14% as compared to a 11% decrease in the state of Oregon and an 8% decrease nationally. Figure 5 Flu Vaccination rates in Lane County, Oregon Figure 5. Flu vaccine trend over time, comparing the county, state, and national rates. This graph indicates an increase in county flu vaccine rates from 2012 to 2017 of 2% as compared to a 2% increase in the state of Oregon and a 1% increase nationally. Figure 6 Children in Poverty in Lane County, Oregon Figure 6. Children in poverty trend over time, comparing the county, state, and national rates. This graph indicates an increase in county children in poverty rates from 2002 to 2018 of 5% as compared to a 1% increase in the state of Oregon and a 1% increase nationally. Figure 7 Air Pollution in Lane County, Oregon Figure 7. Air pollution trend over time, comparing the county, state, and national rates (micrograms per cubic meter). This graph indicates a decrease in county air pollution rates from 2002 to 2014 of 5 micrograms per cubic meter as compared to a 1 microgram per cubic meter decrease in the state of Oregon and a 2 microgram per cubic meter decrease nationally. C. Health Factors Health Factors Table Factors Influencing Health County Data Top U.S. Performer State Data Percentage Adult Smoking 15% 14% 16% Percentage with Access to Exercise Opportunities 89% 91% 88% Percentage Excessive Drinking 19% 13% 19% Primary Care Physicians (Ratio of Population to 1 Physician) 1,140:1 1,030: 1 1,060:1 Percentage with High School Graduation 73% 96% 77% Percentage with Some College 70% 73% 70% Percentage with Unemployment 4.5% 2.6% 4.2% Percentage of Children in Single-Parent Households 35% 20% 30% Social Associations (Number of Associations Per 10,000) 9.6 18.4 10.2 Violent Crime (Number of Violent Crimes Per 100,000) Injury Deaths (Number of Injury Deaths Per 10,000) 93 58 74 Percentage of Children Eligible for Free or Reduced-Price Lunch 54% 32% 49% Air Pollution (Average Daily Density of Air Pollutants) 9.9 6.2 7.9 Percentage with Severe Housing Problems 22% 9% 19% Comparison of Data It is important and beneficial to be able to compare local data with that of the state and top USA performers because it can highlight areas where the local county is falling behind in performance. It often highlights factors outside of medical care that are influencing health outcomes, and serves as a call to action for people in communities to be more involved in improving their local communities’ health. In examining the data for Lane County, Oregon compared to Oregon state data and data for top USA performers, several successes and challenges are present. The percentage of adults smoking in Lane County, 15 percent, is one percent less than the state and one percent over the top USA performers for this category. The percentage of people with access to exercise, 89 percent, is also one percent higher than the state but 2 percent lower than top USA performers in this category. An area where Lane County is similar to the state but unfortunately well above national top performers is in excessive drinking, with 19 percent of the local population participating in this on county and state levels versus only 13 percent for top USA performers. The percentage of people in Lane County who graduate high school, 73 percent, is lower than the state average of 77 percent and well below the top USA performers where 96 percent of people graduate. However, the percentage of people with some college education in Lane County, 70 percent is the same as at the state level, and only 3 percent below the top USA performers. The percentage of those who are unemployed in Lane County, 4.5 percent is only slightly higher than the state level of 4.2 percent unemployment rate but worse than the top USA performers with a 2.6 percent unemployment rate. The percentage of children in single parent households in Lane County, 35 percent, is five percent higher than the state and 15 percent higher than top USA performers. The percentage of people with severe housing problems is very high in Lane County, 22 percent which is 3 percent higher than the state and far from the target of 9 percent by top USA performers. The number of violent crimes, per 100,000, in Lane County, 330 is higher than the state number of 249 and unfortunately much higher than USA top performers where only 63 violent crimes occur per 100,000 people. Similarly, the number of injury deaths in Lane County, 93 per 10,000 people is higher than the state, 74 per 10,000 and much higher than the top USA performers where only 58 per 10,000 people die of an injury. The percentage of children eligible for free or reduced-price lunches, 54 percent is slightly higher than the state, 49 percent, and well above the top USA performers of only 32 percent of children eligible. The air pollution in Lane County, though improving lately, is still higher than the state and significantly higher than top USA performers. The average density in Lane County is 9.9 which is 2 points higher than the state and 3.7 points higher than top USA performers. The categories that Lane County is close to target with top USA performers are adult smokers, access to exercise, and percentage of people with some college education. The categories that Lane County needs to improve on most are percentage of people who are excessively drinking, high school graduation rates, percentage of children in single-parent homes as well as those eligible for free or reduced-price lunches, violent crime, death by injury, air pollution and most of all, percentage of people with severe housing problems. D. SUMMARY Significant Findings Sexually transmitted infections (STIs) are on the rise in Lane County, Oregon. From 2007 to 2017, cases of chlamydia have nearly doubled. Currently, there are 490 cases of chlamydia in every 100,000 people in Lane County. That is, 0.49% of the population in the county has chlamydia. The rates for gonorrhea in Lane County are 134 per 100,000 people, and for syphilis, 26 per 100,000 people (“Oregon county STD data”, 2019). All three of these infections can lead to serious health consequences when left untreated and unaddressed, the spread can become rampant. The Center for Disease Control and Prevention (CDC), reports that STIs “cause many harmful, often irreversible, and costly clinical complications, such as: reproductive health problems, fetal and perinatal health problem, cancer, [and] facilitation of the sexual transmission of HIV infection” (CDC, 2019). There are several factors that contribute to the spread of and prevalence of STIs. Firstly, biological factors such as the fact that sometimes, STIs can be asymptomatic and are consequently unaddressed and medical care is not sought. Another biological factor is that women are likely to suffer more serious complications than men, and are likely to show symptoms more than men who might be silent carriers. Social, economic, and behavioral factors can incur obstacles to STI prevention because “their influence on social and sexual networks, access to and provision of care, willingness to seek care, and social norms regarding sex and sexuality. Among certain vulnerable populations, historical experience with segregation and discrimination exacerbates the influence of these factors” (CDC, 2019). STIs are often prevalent in groups where access to health care is limited and people are living in poverty. in Lane County, 8 percent of the population is uninsured and 22 percent of children are living in poverty with a 4.5 percent unemployment rate in the county. Additionally, STIs are associated with substance abuse, which is evident in Lane County by the high number of overdose deaths, 19 per 100,000 people, alcohol impaired driving deaths 31 percent, and excessive drinking rates, 19 percent. The CDC reports that “the introduction of new illicit substances into communities often can alter sexual behavior drastically in high-risk sexual networks, leading to the epidemic spread of STDs (CDC, 2019). A social factor that increases the spread of STIs is the stigma surrounding these infections and hesitation of people to discuss this with medical providers and share this with intimate partners. Despite how quickly and easily STIs can spread, they are actually largely preventable. Almost all STIs can be treated and cured in a couple weeks with antibiotics, prevented with a vaccine and condoms. An action plan can be formed to significantly improve community health outcomes in Lane County in regard to slowing the rise of STI rates. Action Plan An action plan to target the rising STI rates in Lane county is necessary to slow the spread and prevent increasing burdens, costs, and complications that are the consequences of STIs. This action plan consists of three initial steps: expedited partner therapy, increased data collection and testing, and improved communication strategies for education on sexual health and STI prevention. According to the CDC, “each state must address system-level barriers to timely treatment of partners of persons infected with STDs, including the implementation of expedited partner therapy for the treatment of chlamydial and gonorrheal infections” (CDC, 2019). Expedited partner therapy is the practice of treating sexual partners of patients who are diagnosed with an STI by giving that patient a prescription to give to their partner, without the medical provider having to see or examine the partner of the patient. This is beneficial for several reasons. Firstly, because when a partner is asymptomatic they may defer seeking treatment, this mitigates the need for the partner to physically go to the healthcare provider. Additionally, this prevents reinfection and limits further transmission if both partners are being treated. Finally, this improved efficiency for healthcare providers who may have limited resourced or space to see new patients. Since expedited partner therapy is already legalized in Oregon, the first step of this action plan is to advertise to local healthcare providers, Planned Parenthood, school and college health clinics, and citizens of the county, that if they are being treated for an STI, they can get treatment for their partner too. Spreading awareness of this option is important as not all citizens or providers know they have the ability to access STI medication without an in- person evaluation. This also helps because some people in Lane County are uninsured and are often deterred because of the cost of seeking treatment. Requesting funding from the Lane County Public Health Department and local government to cover medications for expedited partner therapy is part of this step of the action plan. The second part of the action plan is focused on increased data collection and testing. The CDC recommends annual testing for sexually active adults between 15 and 24 years old, all pregnant women and at least once in a lifetime for HIV for persons between the ages of 13 and 64 (CDC, 2019). Again, the issue of people avoiding medical treatment because of the cost and lack of insurance comes into play. Further funding will be requested to cover the costs of screenings and STI testing in this part of the action plan. Increased testing allows for earlier recognition and treatment of STIs, especially for those that are asymptomatic carriers. The sooner these can be treated, the less likely they will be spread to others. More testing sites will be opening throughout the county as well as in schools. The final part of this action plan is to normalize the discussion of sexual health starting at a young age. School systems need to debunk the stigmas surrounding sexual health, and a petition for sexual health to be part of a health class curriculum in all schools is necessary. Education and early exposure to accurate information about sexual health and STIs is integral in changing the stigmas and the ways people think about STIs. Additionally, this curriculum is critical to address educating young people about the importance of testing, the consequences of STIs, and how easily preventable they can be. School systems can also be vital to this action plan because school health clinics can offer HPV vaccinations, condoms, and screening sites for people. Increased funding for a sexual health curriculum and school health clinics that offer free vaccines, condoms, and testing is part of this action plan as well. Services or Programs As previously discussed in the action plan, there are several key services that will be offered to the county to decrease the prevalence of STIs. Firstly, expedited partner therapy will be a service offered by healthcare providers so that when one sexual partner is treated for an STI, their sexual partner(s) can have a prescription to medication treatment as well. This service will also be offered for free if a person does not have insurance or cannot cover the copay on their own. The next service offered will be testing, which can be done for free for anyone. A program that will be starting is the school curriculum for health classes that focuses on normalizing sexual health, de-stigmatizing STIs, educating students on STI prevention and consequences, and advocates for safe sexual practices. As part of this program, schools will also be offering testing services, vaccinations, and condoms for free. Raise Public Awareness and Promote Public Engagement In order to engage the community in the goal to decrease STI rates in Lane County, raising public awareness is key. The first way to raise public awareness and promote public engagement in this action plan is through social media platforms. A Twitter, Facebook, and Instagram platform will be formed to post information about the local statistics, data, and trends of STI rates in the last several years. Using Excel spreadsheets to list local data and create graphics on STIs, this will be shared to community members through easily comprehensible visual representations such as bar graphs and tree-map charts. In addition to this educational material on these platforms, information on the new services and programs will be available and advertised. Posts on each platform will be made to highlight testing sites, where to get free vaccinations, free condoms, and promoting expedited partner therapy. Daily posts will be made to normalize sexual health, decrease the stigmas surrounding STIs by debunking myths, and promoting testing and STI prevention. The next way in which technology will be used to raise public awareness is targeted towards health care providers. Raising the awareness of expedited partner therapy is an important aspect of this action plan and not all providers know of their ability to offer this service to patients. To spread awareness of the importance of decreasing STI rates in the county, email electronic newsletters will be sent to all healthcare providers and clinics throughout the county to communicate information about the recent STI trends and encourage expedited partner therapy. Excel spreadsheets will be used to show a graph of the STI rates in the county compared to rates in the state and nation over the past decade to show the increase and demonstrate the need for prevention management. Another way informatics will be used in raising public awareness is sharing a news article in the local newspaper that contains column charts and trend graphs created in Excel that show the prevalence of STIs based on age, race, sex, and income as well as trends over time. This information educates and catches the attention of local community members by spreading awareness. In this article, information about the campaign to decrease STI rates in Lane County will be shared, as well as contact information for the social media platforms and where to get tested or seek treatment. Finally, there will be an app created where local community members can find their nearest local testing site and check in online to reduce wait times. This app will also collect data on who is utilizing these services and over time this data can be collected to track trends on patient demographics and needs. This information will be anonymous for other users to protect patient privacy. Monitoring and Evaluating Action Plan Monitoring and evaluating the action plan is an important aspect in guiding the prevention efforts and ensuring the plan is effectively working towards decreasing STI rates. Excel spreadsheets is an excellent data server that allows users to log data, easily track statistical variables, and then convert this data into visually representative images and graphs. Over the course of the year that this plan is implemented, data will be collected from the local public health department on the total number of new STI cases since these are all reported by diagnosing providers to the public health department. Additionally, all clinicians will report weekly, how many people use expedited partner therapy for treatment. These numbers will be collected in an Excel spreadsheet along with relevant clinical, demographic, and socioeconomic factor information about each treated patient. These factors will be: age, sex, race, yearly income, whether that person is insured, and if they took medication for their STI. This information is relevant and important to understand epidemiology of STIs and help target populations who need increased prevention efforts. Through the Excel program, graphs can be created based on these factors. For example, STI trends can be sorted comparing genders and races, races and ages, genders and races and ages, etc. in order to see where rates are most prevalent. A column chart will be created to compare each of these factors and visually demonstrate prevalence. Schools will provide data on who is getting vaccinated and their demographic and socioeconomic factors. This will be made into a trend graph using Excel to see which population is using these resources. Clinics and testing sites will report how many patients they see a day which will be graphed based on days of the week and months using Excel to see when patients most frequently utilize these resources. Data from the phone app that tracks patients checking in and using services will be collected and charted in a visual graph. Overall, trends of STIs in the county will be graphed to see if they are decreasing over the course of the year. These graphs allow for the action plan to be monitored and evaluated, and answer the questions: “is this effectively decreasing STI rates?”, “which population is using these resources the most and how can these resources be made more available to other populations?” and “what patterns can be seen surrounding STI rates in Lane County?” E. DATA SOURCES & METHODS In this data brief all data was collected using the University of Wisconsin Population Health Institute County Health Rankings website. This organization collects measurements of health on almost all counties in the United States and ranks them within states. The data is compiled using a wide variety of both national and state sources and then standardized and combined. According to Remington, Catlin, and Gennuso, “data for over 30 measures available at the county level are assembled from a number of national sources. Z-scores are calculated for each measure, multiplied by their assigned weights, and summed to create composite measure scores. Composite scores are then ordered and counties are ranked from best to worst health within each state” (2015). The website used to collect data for this data brief can be reached at
Geschreven voor
Documentinformatie
- Geüpload op
- 1 augustus 2021
- Aantal pagina's
- 27
- Geschreven in
- 2021/2022
- Type
- Case uitwerking
- Docent(en)
- Nursejolly
- Cijfer
- A+
Onderwerpen
- oregon
-
wgu d029 population health data brief lane county
Ook beschikbaar in voordeelbundel