Sophia Statistics Final Milestone
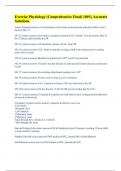
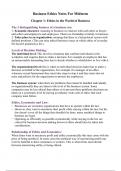
Sophia Statistics Final Milestone This chart shows the number of students of different age groups who participated in a quiz. Which of the following statements about the stack plot is true? There were more male students in the age group 19-21 than in the age group 15-17. There were more male students than female students in the age group 19-21. There were more female students in the age group 17-19 than in any other age group. There were more students in the age group 15-17 than in any other age group. Which of the scenarios below will provide Jay with available data? Going to a local high school and asking the principal for information about students' previous grades, then interviewing a random selection of students about their eating habits. Going to a local high school and asking the principal for information about students' current and previous grades, then interviewing a random selection of students about their eating habits. Going to a local high school and asking the principal for information about students' current and previous grades, then asking the health teacher for the results from a survey students to
Geschreven voor
Documentinformatie
- Geüpload op
- 29 juli 2021
- Aantal pagina's
- 22
- Geschreven in
- 2020/2021
- Type
- Tentamen (uitwerkingen)
- Bevat
- Vragen en antwoorden
Onderwerpen
-
sophia statistics final milestone this chart shows the number of students of different age groups who participated in a quiz which of the following statements about the stack plot is true there were