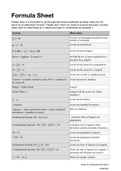
Formula Sheet
Please note: it is important to go through the lecture podcasts as these notes do not
serve as an alternative to them. Please don’t send my notes to anyone because I worked
really hard to make these as in depth and easy to understand as possible :)
Formula What it does
∑𝑓 = N The sum of the frequencies gives the total
number of individuals
p= 𝑓 ÷ N (work out proportion)
P (100) = (𝑓 ÷ N) x 100 (work out percentages)
Rows = highest - Lowest +1 (to find the no. of rows required for a
grouped freq. graph)
𝜇 = ∑X ÷ N (work out the mean for a population)
M = ∑X ÷ n (work out the mean for a sample)
(∑X₁ + ∑X₂) ÷ (n₁ + n₂) (work out overall or weighted mean)
Fraction = (number needed to reach 50%) ÷ (number in (work out precise median)
the interval)
Range = Xmax-Xmin (range)
Xmax-Xmin +1 (range if all the scores are whole
numbers)
X-𝜇 (work out deviation)
√variance (work out standard deviation)
Variance = mean squared deviation = (sum of squared Work out Variance
deviations) ÷ (number of scores)
Definitional formula: SS = ∑( X-𝜇)² (calculate Sum of Squares for
population)
Computational formula : SS= ∑X² - ((∑X)² ÷ N) (calculate sum of squares when
deviation contains decimals/ fractions)
SS ÷ N (work out population variance)
√ (SS ÷ N) (work out population standard
deviation)
Definitional formula: SS= ∑ (X - M)² (work out Sum of Squares for sample)
Computational formula: SS= ∑X² - ((∑X)² ÷ n) Work out sum of Squares for sample if
decimals and fractions are involve
s² = SS ÷ (n-1) Work out sample variance
Notes by: Michaela Goncalves
22587934