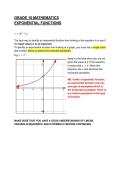
GRADE 10 MATHEMATICS
EXPONENTIAL FUNCTIONS
𝑥
𝑦 = 𝑎𝑏 + 𝑞
The best way to identify an exponential function from looking at the equation is to see if
the input value (𝑥) is an exponent.
To identify an exponential function from looking at a graph, you must see a single curve
that is either above or below the horizontal asymptote.
𝑥
E.g 𝑦 = 2
Keep in mind that when you are not
given the value of 𝑞 in the equation,
it means that 𝑞 = 0. When this
happens, the 𝑥-axis becomes the
horizontal asymptote.
NB: Unlike a hyperbolic function,
an exponential function only has
one type of asymptote which is
the horizontal asymptote. There is
no vertical asymptote in this type
of function.
MAKE SURE THAT YOU HAVE A GOOD UNDERSTANDING OF LINEAR,
PARABOLIC/QUADRATIC AND HYPERBOLIC BEFORE CONTINUING.
,GLOSSARY
TERM/SYMBOL WHAT IT MEANS/ HOW TO FIND IT
REPRESENTS
𝑎 This represents the It is always the coefficient
position of the graph. It of 𝑏. If 𝑏 has no coefficient,
tells us whether the graph 𝑎 = 1. If you are given an
will be above or below the 𝑥
equation like 𝑓(𝑥) =− 2 , if
horizontal asymptote. you see a negative sign
next to the value of 𝑏, it
actually means that
𝑎 =− 1.
When looking at a graph:
If the graph is above the
horizontal asymptote
𝑎 > 0 (positive).
If the graph is below the
horizontal asymptote
𝑎 < 0 (negative).
𝑏 This value shows whether It is always the value that
the graph is has the unknown exponent
increasing/growing or 𝑥
e.g 𝑔(𝑥) =− 3 , in this
decreasing/decaying. case 𝑏 = 3.
NB: THE VALUE OF 𝑏 IS
NOT ALLOWED TO BE
NEGATIVE, THIS IS WHY
WE SEEM TO IGNORE
THE NEGATIVE SIGN
WHEN LOOKING FOR 𝑏.
IT IS ALSO NOT
ALLOWED TO BE 1.
Increase/Growth It means that when you When the value of 𝑏 is any
look at the graph from left number that is greater than
to right, it is moving away 1 (𝑏 > 1), the graph is
from the horizontal increasing/growing.
asymptote.
Decrease/Decay It means that when you When the value of 𝑏 is any
look at the graph from left number that is greater than
to right, it is moving 0 but less than 1
closer to the horizontal (0 < 𝑏 < 1), the graph is
, asymptote. decreasing/decaying.
𝑞 This value represents the Look at your graph and
value of the horizontal identify a horizontal
asymptote and the vertical dashed line (this is the
shift ONLY. horizontal asymptote), the
IT DOES NOT exact point this line cuts
REPRESENT THE 𝑦 through the y-axis will be
-intercept. your value of the 𝑞.
Horizontal Asymptote This is an invisible The value of 𝑞 always
horizontal line that the represents this asymptote
graph moves closer to ( 𝑦 = 𝑞). When the value is
but never actually 0 that means that the 𝑥
touches it (We indicate -axis will represent the
the presence of this line asymptote.
through the use of dashed
lines). It represents the
point in which the graph
does not exist (The 𝑦-value
for that point does not
work).
In the exponential function,
we do not have a vertical
asymptote.
𝑥-intercept The exact point where the You can calculate it by
graph cuts through the letting the value of
horizontal x-axis. 𝑦 = 0 in the equation and
using your algebraic skills
to solve for 𝑥.
𝑦-intercept The exact point where the You can calculate it by
graph cuts through the letting the value of
vertical y-axis. 𝑥 = 0 in the equation and
using your algebraic skills
to solve for 𝑦.
Vertical shift It is the up and down The value of q indicates
movement of the function. how much it has moved up
or down
EXPONENTIAL FUNCTIONS
𝑥
𝑦 = 𝑎𝑏 + 𝑞
The best way to identify an exponential function from looking at the equation is to see if
the input value (𝑥) is an exponent.
To identify an exponential function from looking at a graph, you must see a single curve
that is either above or below the horizontal asymptote.
𝑥
E.g 𝑦 = 2
Keep in mind that when you are not
given the value of 𝑞 in the equation,
it means that 𝑞 = 0. When this
happens, the 𝑥-axis becomes the
horizontal asymptote.
NB: Unlike a hyperbolic function,
an exponential function only has
one type of asymptote which is
the horizontal asymptote. There is
no vertical asymptote in this type
of function.
MAKE SURE THAT YOU HAVE A GOOD UNDERSTANDING OF LINEAR,
PARABOLIC/QUADRATIC AND HYPERBOLIC BEFORE CONTINUING.
,GLOSSARY
TERM/SYMBOL WHAT IT MEANS/ HOW TO FIND IT
REPRESENTS
𝑎 This represents the It is always the coefficient
position of the graph. It of 𝑏. If 𝑏 has no coefficient,
tells us whether the graph 𝑎 = 1. If you are given an
will be above or below the 𝑥
equation like 𝑓(𝑥) =− 2 , if
horizontal asymptote. you see a negative sign
next to the value of 𝑏, it
actually means that
𝑎 =− 1.
When looking at a graph:
If the graph is above the
horizontal asymptote
𝑎 > 0 (positive).
If the graph is below the
horizontal asymptote
𝑎 < 0 (negative).
𝑏 This value shows whether It is always the value that
the graph is has the unknown exponent
increasing/growing or 𝑥
e.g 𝑔(𝑥) =− 3 , in this
decreasing/decaying. case 𝑏 = 3.
NB: THE VALUE OF 𝑏 IS
NOT ALLOWED TO BE
NEGATIVE, THIS IS WHY
WE SEEM TO IGNORE
THE NEGATIVE SIGN
WHEN LOOKING FOR 𝑏.
IT IS ALSO NOT
ALLOWED TO BE 1.
Increase/Growth It means that when you When the value of 𝑏 is any
look at the graph from left number that is greater than
to right, it is moving away 1 (𝑏 > 1), the graph is
from the horizontal increasing/growing.
asymptote.
Decrease/Decay It means that when you When the value of 𝑏 is any
look at the graph from left number that is greater than
to right, it is moving 0 but less than 1
closer to the horizontal (0 < 𝑏 < 1), the graph is
, asymptote. decreasing/decaying.
𝑞 This value represents the Look at your graph and
value of the horizontal identify a horizontal
asymptote and the vertical dashed line (this is the
shift ONLY. horizontal asymptote), the
IT DOES NOT exact point this line cuts
REPRESENT THE 𝑦 through the y-axis will be
-intercept. your value of the 𝑞.
Horizontal Asymptote This is an invisible The value of 𝑞 always
horizontal line that the represents this asymptote
graph moves closer to ( 𝑦 = 𝑞). When the value is
but never actually 0 that means that the 𝑥
touches it (We indicate -axis will represent the
the presence of this line asymptote.
through the use of dashed
lines). It represents the
point in which the graph
does not exist (The 𝑦-value
for that point does not
work).
In the exponential function,
we do not have a vertical
asymptote.
𝑥-intercept The exact point where the You can calculate it by
graph cuts through the letting the value of
horizontal x-axis. 𝑦 = 0 in the equation and
using your algebraic skills
to solve for 𝑥.
𝑦-intercept The exact point where the You can calculate it by
graph cuts through the letting the value of
vertical y-axis. 𝑥 = 0 in the equation and
using your algebraic skills
to solve for 𝑦.
Vertical shift It is the up and down The value of q indicates
movement of the function. how much it has moved up
or down