LITERATUUR WEEK 4
FIELD
CHAPTER 9 THE LINEAR MODEL ( REGRESSION )
9.2 AN INTRODUCTION TO THE LINEAR MODEL (REGRESSION)
9.2.1 THE LINEAR MODEL WITH ONE PREDICTOR
The model:
This equation keeps the fundamental idea that an outcome for a person can be predicted from a model and
some error associated with that prediction (εi). We still predict an outcome variable (Yi) form a predictor
variable (Xi) and a parameter, b1, associated with the predictor variable that quantifies the relationship is has
with the outcome variable. This model differs from that of a correlation only in that is uses an unstandardized
measure of the relationship (b1) and consequently we include a parameter b0, that tells us the value of the
outcome when the predictor is 0.
Let’s image that instead of b0 we use the letter c, and instead of b1 we use the letter m , also ignore the error
term. We could predict our outcome as:
Outcomei = mx + c
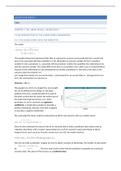
This equation is a form of a straight line. Any straight
line can be defined by two things; (1) the slope /
gradient of the line ( usually denoted by b1) and (2)
the point at which the line crosses the vertical axis of
the graph (intercept) also known as b1. These
parameters b0 and b1 are known as regression
coefficients. A model with a positive b1 describes a
positive relationship, whereas a line with a negative
b1 describes a negative relationship.
We could adapt the linear model by replacing the predictor and outcome with our variable names;
Once we have estimated the values of the bs we would be able to make a prediction about album sales by
replacing ‘advertising’ with a number representing how much we wanted to spend advertising an album.
Imagine that b0 turns out to be 50 and b1 turned out to be 100. Our model would be:
Now we can make a prediction. Imagine we want to spend 5 pounds on advertising. The number of sales would
be: . The error term is left to show that this prediction is probably not a perfectly
accurate value. This value of 550 is known as a predicted value.
, 9.2.2 THE LINEAR MODEL WITH SEVERAL PREDICTORS
Life is usually complicated and there will be numerous variables that might be related to the outcome that you
want to predict. Ad additional predictor can be placed in the model and given b to estimate its relationship to
the outcome:
Al that has changed is the addition of a
second predictor (X2) and an associated
parameter (b2). The number of plays of
the band (airplay) added to the model
makes the model the following:
The new model includes a b-value for both predictors. By estimating the b-values, we can make predictions
about album sales based on the amount spent on advertising AND also on airplay. This results in a regression
plane , which aims to give the best prediction for the observed data. The vertical distances between the plan
and each data point are the errors or residuals in the model. However, with 3 or 4 or more predictors you can’t
immediately visualize what the model looks like, but you can apply the principle of these basic models to more
complex scenarios. In general, we can add as many predictors as we like, provided we give them a b and the
linear model expands accordingly:
To sum up, regression analysis is a term for fitting a linear model to data and using it to predict values of an
outcome variable from one or more predictor variables. With one predictor variable, the technique is referred
to as simple regression. With several predictors it is called multiple regression.
9.2.3 ESTIMATING THE MODEL
We estimate parameters typically with the use of the
method of least squares from 2.6. by looking at the
deviation between the model and the data collected the
vertical distances between what the model predicted and
each data point that was observed. We can do the same to
assess the fit of a regression line ( or plane ).
A model ( the straight line) has been fitted to the data on
the right. The blue circles are the observed data. We
estimated the b values that define the model and put
these values into the linear model, then insert different
values for advertising budget, the predicted values are the
resulting estimates of album sales. If we insert the
observed values of advertising budget into the model to
get these predicted values, then we gauge how well the model fits. If the model is a perfect fit to the data then
for a given value of predictors the model will predict the same value of the outcome as observed. This would
mean that the orange and the blue dots fall in the same location. Most models are not perfect. With the linear
model the differences between what the model predicts and the observed data are called residuals. They are
the vertical dashed lines.
FIELD
CHAPTER 9 THE LINEAR MODEL ( REGRESSION )
9.2 AN INTRODUCTION TO THE LINEAR MODEL (REGRESSION)
9.2.1 THE LINEAR MODEL WITH ONE PREDICTOR
The model:
This equation keeps the fundamental idea that an outcome for a person can be predicted from a model and
some error associated with that prediction (εi). We still predict an outcome variable (Yi) form a predictor
variable (Xi) and a parameter, b1, associated with the predictor variable that quantifies the relationship is has
with the outcome variable. This model differs from that of a correlation only in that is uses an unstandardized
measure of the relationship (b1) and consequently we include a parameter b0, that tells us the value of the
outcome when the predictor is 0.
Let’s image that instead of b0 we use the letter c, and instead of b1 we use the letter m , also ignore the error
term. We could predict our outcome as:
Outcomei = mx + c
This equation is a form of a straight line. Any straight
line can be defined by two things; (1) the slope /
gradient of the line ( usually denoted by b1) and (2)
the point at which the line crosses the vertical axis of
the graph (intercept) also known as b1. These
parameters b0 and b1 are known as regression
coefficients. A model with a positive b1 describes a
positive relationship, whereas a line with a negative
b1 describes a negative relationship.
We could adapt the linear model by replacing the predictor and outcome with our variable names;
Once we have estimated the values of the bs we would be able to make a prediction about album sales by
replacing ‘advertising’ with a number representing how much we wanted to spend advertising an album.
Imagine that b0 turns out to be 50 and b1 turned out to be 100. Our model would be:
Now we can make a prediction. Imagine we want to spend 5 pounds on advertising. The number of sales would
be: . The error term is left to show that this prediction is probably not a perfectly
accurate value. This value of 550 is known as a predicted value.
, 9.2.2 THE LINEAR MODEL WITH SEVERAL PREDICTORS
Life is usually complicated and there will be numerous variables that might be related to the outcome that you
want to predict. Ad additional predictor can be placed in the model and given b to estimate its relationship to
the outcome:
Al that has changed is the addition of a
second predictor (X2) and an associated
parameter (b2). The number of plays of
the band (airplay) added to the model
makes the model the following:
The new model includes a b-value for both predictors. By estimating the b-values, we can make predictions
about album sales based on the amount spent on advertising AND also on airplay. This results in a regression
plane , which aims to give the best prediction for the observed data. The vertical distances between the plan
and each data point are the errors or residuals in the model. However, with 3 or 4 or more predictors you can’t
immediately visualize what the model looks like, but you can apply the principle of these basic models to more
complex scenarios. In general, we can add as many predictors as we like, provided we give them a b and the
linear model expands accordingly:
To sum up, regression analysis is a term for fitting a linear model to data and using it to predict values of an
outcome variable from one or more predictor variables. With one predictor variable, the technique is referred
to as simple regression. With several predictors it is called multiple regression.
9.2.3 ESTIMATING THE MODEL
We estimate parameters typically with the use of the
method of least squares from 2.6. by looking at the
deviation between the model and the data collected the
vertical distances between what the model predicted and
each data point that was observed. We can do the same to
assess the fit of a regression line ( or plane ).
A model ( the straight line) has been fitted to the data on
the right. The blue circles are the observed data. We
estimated the b values that define the model and put
these values into the linear model, then insert different
values for advertising budget, the predicted values are the
resulting estimates of album sales. If we insert the
observed values of advertising budget into the model to
get these predicted values, then we gauge how well the model fits. If the model is a perfect fit to the data then
for a given value of predictors the model will predict the same value of the outcome as observed. This would
mean that the orange and the blue dots fall in the same location. Most models are not perfect. With the linear
model the differences between what the model predicts and the observed data are called residuals. They are
the vertical dashed lines.