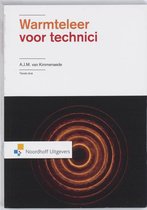
WARMTELEER VOOR TECHNICI
Samenvatting Grafieken
Alle toestandsdiagrammen, isolijnen en kringprocessen — wat je eruit afleest, wat de
oppervlaktes betekenen, en hoe je ze zelf tekent op het examen.
Kleurcodering (overal consistent)
• Isotherm — T constant
• Isobaar — p constant
• Isochoor — v constant
• Isentroop — s constant (adiabaat)
• Polytroop — pVⁿ = C
• Verzadigingskoepel — reële stoffen
,Inhoud
Inhoud.......................................................................................................................................... 2
1. De drie fundamentele diagrammen..........................................................................................3
2. Het p-V diagram....................................................................................................................... 4
3. Het T-S diagram....................................................................................................................... 5
4. Het h-s diagram (Mollier)..........................................................................................................6
5. Isolijnen cheat-sheet................................................................................................................7
6. Fasediagram & stoomkoepel...................................................................................................8
7. Carnot-cyclus......................................................................................................................... 10
8. Otto-cyclus (benzinemotor)....................................................................................................12
9. Diesel-cyclus.......................................................................................................................... 12
10. Joule / Brayton-cyclus (gasturbine)......................................................................................14
11. Stirling-cyclus....................................................................................................................... 14
12. Rankine-cyclus (stoomcentrale)...........................................................................................16
13. Koelmachine & het p-h diagram...........................................................................................17
14. Isentroop rendement & verloren arbeid................................................................................19
15. Exergie & anergie................................................................................................................ 20
16. Grootheden aflezen — overzicht..........................................................................................21
17. Hoe teken je het zelf?.......................................................................................................... 22
, 1. De drie fundamentele diagrammen
De hele cursus draait rond drie diagrammen. Elk heeft één gouden regel: een bepaalde
oppervlakte stelt een energievorm voor.
Diagram Assen (x — y) Oppervlakte = Sleutelrelatie
p-V V—p Arbeid W W = ∫p·dV
T-S S—T Warmte Q Q = ∫T·dS
h-s (Mollier) s—h verticaal = arbeid/warmte wₜ = h₁−h₂ ; q = Δh
ONTHOUD
p-V → arbeid onder de curve. T-S → warmte onder de curve. h-s → verschillen lees je
verticaal af. Bij een kringproces is de ingesloten oppervlakte in zowel p-V als T-S gelijk aan
de netto arbeid ΣW.
p-V: oppervlakte onder de curve = arbeid (smal strookje p·dV opgeteld).
Samenvatting Grafieken
Alle toestandsdiagrammen, isolijnen en kringprocessen — wat je eruit afleest, wat de
oppervlaktes betekenen, en hoe je ze zelf tekent op het examen.
Kleurcodering (overal consistent)
• Isotherm — T constant
• Isobaar — p constant
• Isochoor — v constant
• Isentroop — s constant (adiabaat)
• Polytroop — pVⁿ = C
• Verzadigingskoepel — reële stoffen
,Inhoud
Inhoud.......................................................................................................................................... 2
1. De drie fundamentele diagrammen..........................................................................................3
2. Het p-V diagram....................................................................................................................... 4
3. Het T-S diagram....................................................................................................................... 5
4. Het h-s diagram (Mollier)..........................................................................................................6
5. Isolijnen cheat-sheet................................................................................................................7
6. Fasediagram & stoomkoepel...................................................................................................8
7. Carnot-cyclus......................................................................................................................... 10
8. Otto-cyclus (benzinemotor)....................................................................................................12
9. Diesel-cyclus.......................................................................................................................... 12
10. Joule / Brayton-cyclus (gasturbine)......................................................................................14
11. Stirling-cyclus....................................................................................................................... 14
12. Rankine-cyclus (stoomcentrale)...........................................................................................16
13. Koelmachine & het p-h diagram...........................................................................................17
14. Isentroop rendement & verloren arbeid................................................................................19
15. Exergie & anergie................................................................................................................ 20
16. Grootheden aflezen — overzicht..........................................................................................21
17. Hoe teken je het zelf?.......................................................................................................... 22
, 1. De drie fundamentele diagrammen
De hele cursus draait rond drie diagrammen. Elk heeft één gouden regel: een bepaalde
oppervlakte stelt een energievorm voor.
Diagram Assen (x — y) Oppervlakte = Sleutelrelatie
p-V V—p Arbeid W W = ∫p·dV
T-S S—T Warmte Q Q = ∫T·dS
h-s (Mollier) s—h verticaal = arbeid/warmte wₜ = h₁−h₂ ; q = Δh
ONTHOUD
p-V → arbeid onder de curve. T-S → warmte onder de curve. h-s → verschillen lees je
verticaal af. Bij een kringproces is de ingesloten oppervlakte in zowel p-V als T-S gelijk aan
de netto arbeid ΣW.
p-V: oppervlakte onder de curve = arbeid (smal strookje p·dV opgeteld).