M2L2: Earthquake 2 – Determination of Epicenter - Honors
Name: Date:
[NOTE TO STUDENTS: This exercise assumes that you have a data table and graph madewhile using
the Earthquakes 1 – Recording Center Gizmo™. If you do not have those, or have never used that
Gizmo before, do that first.]
Vocabulary: body wave, earthquake, epicenter, fault, focus, P wave, S wave, seismic wave,seismogram,
seismograph
Prior Knowledge Questions (Do these BEFORE using the Gizmo.)
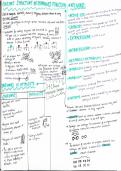
Three dogs meet in a park. Each dog is attached by a leash to its owner (triangles).
What does each colored circle represent?
Each colored circle represents the distance that each dog couldwalk.
The leash would define the radius
Where could all the dogs meet in one place?
c
Is there another spot where all three dogs could meet? no
Explain:
It only intersects at one area
Gizmo Warm-up
When you used the Earthquakes 1 – Recording Station Gizmo™,
you learned how to find the distance from a recording station to the
epicenter. With the Earthquakes 2 – Determination of Epicenter
Gizmo, you will use data from threerecording stations to find the
exact location of the epicenter.
Click Play ( ), and then click Pause ( ) when the seismograms are
complete. Compare the three seismograms.
Which recording station is closest to the epicenter? c
How do you know?
the lag phase between p and s waves is the shortest
Which recording station is farthest from the epicenter? b
How do you know?
the lag phase between p and s waves is the longest
, M2L2: Earthquake 2 – Determination of Epicenter - Honors
Get the Gizmo ready:
Activity:
● Click Reset ( ).
Locating the
● Click Play, and then click Pause when the
epicenter
seismograms are complete.
Goal: Based on three seismograms, locate the epicenter of an earthquake.
Prepare: To complete this activity, you will need the table and graph you made in the Earthquakes 1 –
Recording Station Student Exploration. Take this out now. If you do not haveit, there is a graph you can
use at the end of this report.
Measure: Turn on Show time probe. On each seismogram, locate the first P-wave and the firstS-wave.
Measure the time interval (∆t) for each seismogram, and then use your graph to find the distance of each
station to the epicenter.
Use the graph provided on the last page of this report to determine the distances.
Station Time interval (∆t) Distance to epicenter (km)
A 62sec 483
B 106 826
C 48 374
Locate: Turn on the Show station A checkbox. Set the Radius to the distance of station A
from the epicenter, based on your table above. Look on the circle on the map.
Where could the epicenter be located? Where all the circles intersect
Locate: Turn on the Show station B checkbox. Set the Radius to the distance of station B
from the epicenter. Look on the two circles on the map.
Which two places could the epicenter be located now?
Where A and B intersect
Locate: Turn on the Show station C checkbox. Set the Radius to the distance of station C from the
epicenter. If you did everything right, you should see the epicenter symbol ( ). If youdo not, recheck all
of your distances. (You may need to adjust each radius slightly.)
Relative to the three circles, where is the epicenter located?
close to the intersection of all three circles
Once you locate the epicenter, click the Tools palette and click Screen shot and insert thepicture into the
space below.
Right-click the image, choose “Copy Image,” and paste the image into the space below.
Be sure the screenshots are large (expand them inside each cell), so that it can be
easily read when you hand this report in.
Gizmos stopped letting me screenshot /working so what should I do?
Name: Date:
[NOTE TO STUDENTS: This exercise assumes that you have a data table and graph madewhile using
the Earthquakes 1 – Recording Center Gizmo™. If you do not have those, or have never used that
Gizmo before, do that first.]
Vocabulary: body wave, earthquake, epicenter, fault, focus, P wave, S wave, seismic wave,seismogram,
seismograph
Prior Knowledge Questions (Do these BEFORE using the Gizmo.)
Three dogs meet in a park. Each dog is attached by a leash to its owner (triangles).
What does each colored circle represent?
Each colored circle represents the distance that each dog couldwalk.
The leash would define the radius
Where could all the dogs meet in one place?
c
Is there another spot where all three dogs could meet? no
Explain:
It only intersects at one area
Gizmo Warm-up
When you used the Earthquakes 1 – Recording Station Gizmo™,
you learned how to find the distance from a recording station to the
epicenter. With the Earthquakes 2 – Determination of Epicenter
Gizmo, you will use data from threerecording stations to find the
exact location of the epicenter.
Click Play ( ), and then click Pause ( ) when the seismograms are
complete. Compare the three seismograms.
Which recording station is closest to the epicenter? c
How do you know?
the lag phase between p and s waves is the shortest
Which recording station is farthest from the epicenter? b
How do you know?
the lag phase between p and s waves is the longest
, M2L2: Earthquake 2 – Determination of Epicenter - Honors
Get the Gizmo ready:
Activity:
● Click Reset ( ).
Locating the
● Click Play, and then click Pause when the
epicenter
seismograms are complete.
Goal: Based on three seismograms, locate the epicenter of an earthquake.
Prepare: To complete this activity, you will need the table and graph you made in the Earthquakes 1 –
Recording Station Student Exploration. Take this out now. If you do not haveit, there is a graph you can
use at the end of this report.
Measure: Turn on Show time probe. On each seismogram, locate the first P-wave and the firstS-wave.
Measure the time interval (∆t) for each seismogram, and then use your graph to find the distance of each
station to the epicenter.
Use the graph provided on the last page of this report to determine the distances.
Station Time interval (∆t) Distance to epicenter (km)
A 62sec 483
B 106 826
C 48 374
Locate: Turn on the Show station A checkbox. Set the Radius to the distance of station A
from the epicenter, based on your table above. Look on the circle on the map.
Where could the epicenter be located? Where all the circles intersect
Locate: Turn on the Show station B checkbox. Set the Radius to the distance of station B
from the epicenter. Look on the two circles on the map.
Which two places could the epicenter be located now?
Where A and B intersect
Locate: Turn on the Show station C checkbox. Set the Radius to the distance of station C from the
epicenter. If you did everything right, you should see the epicenter symbol ( ). If youdo not, recheck all
of your distances. (You may need to adjust each radius slightly.)
Relative to the three circles, where is the epicenter located?
close to the intersection of all three circles
Once you locate the epicenter, click the Tools palette and click Screen shot and insert thepicture into the
space below.
Right-click the image, choose “Copy Image,” and paste the image into the space below.
Be sure the screenshots are large (expand them inside each cell), so that it can be
easily read when you hand this report in.
Gizmos stopped letting me screenshot /working so what should I do?