

Physics chapter 4 forces and motion
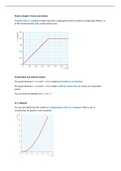
A speed, time (v, t) diagram shows you with a single glance how to motion is progressed. Where t is
at the horizontal axes and v at the vertical axes.
Acceleration and uniform motion
The graph between t = 0 s and t = 4.0 s is called a(n) (uniform) acceleration.
The graph between t = 4.0 and t = 7.0 is called a uniform motion, the car moves at a contestant
speed.
You can write acceleration as a = 3 m / s2
(x, t) diagram
You can also determine the motion in a displacement, time (x, t) diagram. When a car is
accelerating, the graph is more parabolic.
, (Uniform) Deceleration
The following graph shows you a uniform deceleration, the graph is decreasing in a straight line.
The graph shows you that the initial speed v = 12 m / s. The speed after 1 second is v = 10 m / s, and
after 2 seconds the speed is v = 8 m / s. The speed is decreasing by 2 m / s every second.
The deceleration can be written as following: a = - 2 m / s. It's a negative number because it
decreases.
Calculating the acceleration
You can calculate the change in speed ∆v by using the formula ∆v = vf - vi
Where:
Vf The final speed is (end)
Vi The initial speed is (begin)
The same goes for ∆t but then in seconds.
To calculate the acceleration, you use the formula:
a = ∆v / ∆t
where:
• a is the acceleration in metres per second squared (m/s 2);
• ∆v = vf − vi = the change in speed in metres per second (m/s);
• ∆t = tf − ti = the change in time in seconds (s).
A speed, time (v, t) diagram shows you with a single glance how to motion is progressed. Where t is
at the horizontal axes and v at the vertical axes.
Acceleration and uniform motion
The graph between t = 0 s and t = 4.0 s is called a(n) (uniform) acceleration.
The graph between t = 4.0 and t = 7.0 is called a uniform motion, the car moves at a contestant
speed.
You can write acceleration as a = 3 m / s2
(x, t) diagram
You can also determine the motion in a displacement, time (x, t) diagram. When a car is
accelerating, the graph is more parabolic.
, (Uniform) Deceleration
The following graph shows you a uniform deceleration, the graph is decreasing in a straight line.
The graph shows you that the initial speed v = 12 m / s. The speed after 1 second is v = 10 m / s, and
after 2 seconds the speed is v = 8 m / s. The speed is decreasing by 2 m / s every second.
The deceleration can be written as following: a = - 2 m / s. It's a negative number because it
decreases.
Calculating the acceleration
You can calculate the change in speed ∆v by using the formula ∆v = vf - vi
Where:
Vf The final speed is (end)
Vi The initial speed is (begin)
The same goes for ∆t but then in seconds.
To calculate the acceleration, you use the formula:
a = ∆v / ∆t
where:
• a is the acceleration in metres per second squared (m/s 2);
• ∆v = vf − vi = the change in speed in metres per second (m/s);
• ∆t = tf − ti = the change in time in seconds (s).


