Practice Questions
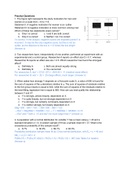
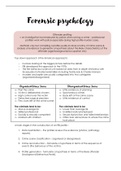
1. The figure right represents the study motivation for men and
women on a scale from –10 to +15.
Statement I: A negative motivation for women is an outlier
Statement II: A negative motivation is more common among men
Which of these two statements is/are correct?
a. Only I is correct c. I and II are both correct
b. Only II is correct d. Neither I nor II is correct
I is correct: In the boxplot, negative scores are separate points II is
incorrect: -5 may be the only negative score, but this is not an
outlier, as the distance to the box is <1.5 times the box length
(Answer a)
2. Two researchers have, independently of one another, performed an experiment with an
experimental and a control group. Researcher A reports an effect size D = 0.7, whereas
Researcher B reports an effect size eta = 0.5. Which researcher has found the strongest
effect?
a. Definitely A c. Both are almost equally strong
b. Definitely B d. You cannot tell
For researcher A: eta 2 ≈ D2/(4 +D2) = .49/4.49 = .11 (medium-sized effect)
For researcher B: eta2 = .52 = .25 (large effect), much larger. (Answer b)
3. When asked how strongly Y depends on a five-point scale X, a value of 800 is found for
the sum of squares of the y-deviations relative to y. The sum of squares of residuals relative
to the five group means is equal to 640, while the sum of squares of the residuals relative to
the best-fitting regression line is equal to 680. How can you best qualify the relationship
between Y and X?
a. Y is strongly, almost linearly, dependent on X
b. Y is quite linearly, but not strongly dependent on X
c. Y is strongly, but certainly not linearly dependent on X
d. Y is neither strongly nor linearly dependent on X
SSg= 800 – 640 = 160 → SSl= 800 – 680 = 120.
→ Eta2 = SSg/SSd = 160/800 = 0.2 → r2 = SSl/SSd = 120/800 = 0.15
→ Eta2 and r2 both ≥ .15 and eta2 not much larger than r2 (Answer a)
4. A population with a normal distribution for variable Y has a mean value μ = 40 and a
standard deviation σ = 6. A random sample of 9 has a sample mean M = 37. What is the
exceedance probability of this sample result?
a. 6.7% b. 30.9% c. 69.1% d. 93.3%
Probability distribution sample mean M as: Circa normal distribution, with Em = µ = 40 and
SEm = σ/ 𝑛 = 6/3 = 2
Pr(M≤37) = Pr(Z≤(37-40)/2) = Pr(Z≤-1.5) = Pr(Z≥1.5) = .067 (see Table A in reader);
(Answer a)
, 5. Which test is the odd one out?
a. Mann-Whitney-U-test c. Wilcoxon Signed-Rank test
b. Independent samples T-test d. Sign test
The T-test is the only parametric test (there are 2 tests for independent groups; and 2 tests
for paired observations) (answer b)
6. In a sample of 40 couples, in 8 couples the men spent more on clothes than their wives,
and in 20 couples the women spent more on clothes than their husbands; no difference was
found for the other 12 couples. What is the approximate one-sided exceedance probability of
this sample?
a. 0.5% b. 1% c. 2% d. 4%
For these data, only the Sign test is appropriate. Calculate the z-value:
At z= 2.08, you find in Table A: p = .0188 ≈ 2% (answer c)
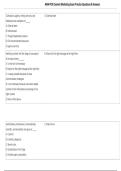
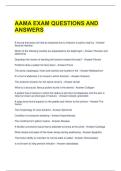
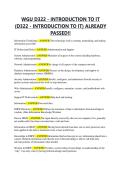
An experiment on the efficiency of intensive study
support on the results of a first-year course involves 36
students. It is expected that age is an influencing
factor, and therefore three age groups are
distinguished. Twelve students have been selected for
each age group, six of whom are randomly selected
and do not receive any study support, whereas the
remaining six do receive such support. The study
support starts one month before the start of the course.
The study result of the students is expressed in a
number.
The diagram below shows the (fictitious) mean
results in the six different groups of six students.
The mean grade for the whole group is 6.5.
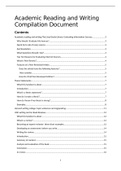
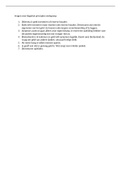
Below you can find the ANOVA table of the two-way variance analysis, with the values left
open in most places.
7. What is the F-value for support in this table?
a. 0.04 b. 11.36 c. 22.27
d. There is not enough information available to draw a conclusion.
F = MSbetween / MSwithin = …./2.20
MSbetween =SSbetween /dfbetween = 49.00/dfbetween = 49.00/k-1=49.00/1 = 49.00
f = 49.00/ 2.20 = 22.27 (answer c)
8. What is the partial eta2 of the interaction between support and age on grade?
a. .056 b. .10 c. .14 d. .175
ssSupport x Age = 135 – (66 + 49 + 6) = 14
Partial eta2 = 14/(14 + 66) = .175 (answer d)
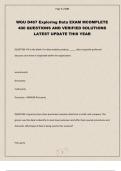
1. The figure right represents the study motivation for men and
women on a scale from –10 to +15.
Statement I: A negative motivation for women is an outlier
Statement II: A negative motivation is more common among men
Which of these two statements is/are correct?
a. Only I is correct c. I and II are both correct
b. Only II is correct d. Neither I nor II is correct
I is correct: In the boxplot, negative scores are separate points II is
incorrect: -5 may be the only negative score, but this is not an
outlier, as the distance to the box is <1.5 times the box length
(Answer a)
2. Two researchers have, independently of one another, performed an experiment with an
experimental and a control group. Researcher A reports an effect size D = 0.7, whereas
Researcher B reports an effect size eta = 0.5. Which researcher has found the strongest
effect?
a. Definitely A c. Both are almost equally strong
b. Definitely B d. You cannot tell
For researcher A: eta 2 ≈ D2/(4 +D2) = .49/4.49 = .11 (medium-sized effect)
For researcher B: eta2 = .52 = .25 (large effect), much larger. (Answer b)
3. When asked how strongly Y depends on a five-point scale X, a value of 800 is found for
the sum of squares of the y-deviations relative to y. The sum of squares of residuals relative
to the five group means is equal to 640, while the sum of squares of the residuals relative to
the best-fitting regression line is equal to 680. How can you best qualify the relationship
between Y and X?
a. Y is strongly, almost linearly, dependent on X
b. Y is quite linearly, but not strongly dependent on X
c. Y is strongly, but certainly not linearly dependent on X
d. Y is neither strongly nor linearly dependent on X
SSg= 800 – 640 = 160 → SSl= 800 – 680 = 120.
→ Eta2 = SSg/SSd = 160/800 = 0.2 → r2 = SSl/SSd = 120/800 = 0.15
→ Eta2 and r2 both ≥ .15 and eta2 not much larger than r2 (Answer a)
4. A population with a normal distribution for variable Y has a mean value μ = 40 and a
standard deviation σ = 6. A random sample of 9 has a sample mean M = 37. What is the
exceedance probability of this sample result?
a. 6.7% b. 30.9% c. 69.1% d. 93.3%
Probability distribution sample mean M as: Circa normal distribution, with Em = µ = 40 and
SEm = σ/ 𝑛 = 6/3 = 2
Pr(M≤37) = Pr(Z≤(37-40)/2) = Pr(Z≤-1.5) = Pr(Z≥1.5) = .067 (see Table A in reader);
(Answer a)
, 5. Which test is the odd one out?
a. Mann-Whitney-U-test c. Wilcoxon Signed-Rank test
b. Independent samples T-test d. Sign test
The T-test is the only parametric test (there are 2 tests for independent groups; and 2 tests
for paired observations) (answer b)
6. In a sample of 40 couples, in 8 couples the men spent more on clothes than their wives,
and in 20 couples the women spent more on clothes than their husbands; no difference was
found for the other 12 couples. What is the approximate one-sided exceedance probability of
this sample?
a. 0.5% b. 1% c. 2% d. 4%
For these data, only the Sign test is appropriate. Calculate the z-value:
At z= 2.08, you find in Table A: p = .0188 ≈ 2% (answer c)
An experiment on the efficiency of intensive study
support on the results of a first-year course involves 36
students. It is expected that age is an influencing
factor, and therefore three age groups are
distinguished. Twelve students have been selected for
each age group, six of whom are randomly selected
and do not receive any study support, whereas the
remaining six do receive such support. The study
support starts one month before the start of the course.
The study result of the students is expressed in a
number.
The diagram below shows the (fictitious) mean
results in the six different groups of six students.
The mean grade for the whole group is 6.5.
Below you can find the ANOVA table of the two-way variance analysis, with the values left
open in most places.
7. What is the F-value for support in this table?
a. 0.04 b. 11.36 c. 22.27
d. There is not enough information available to draw a conclusion.
F = MSbetween / MSwithin = …./2.20
MSbetween =SSbetween /dfbetween = 49.00/dfbetween = 49.00/k-1=49.00/1 = 49.00
f = 49.00/ 2.20 = 22.27 (answer c)
8. What is the partial eta2 of the interaction between support and age on grade?
a. .056 b. .10 c. .14 d. .175
ssSupport x Age = 135 – (66 + 49 + 6) = 14
Partial eta2 = 14/(14 + 66) = .175 (answer d)