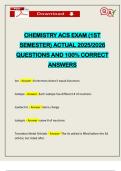
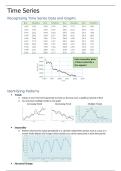
Univariate Data
Univariate Data is data containing one variable
Types of
Data
Categorical Numerical
Ordinal
Discrete
Data that can be put Continuous
Nominal Data that can be
into an order or rank. Data that can be
Data with no sense of counted. (whole
e.g. survey with measured in decimals.
order. e.g. suburbs, numbers) e.g. number
responses good, e.g. distance in long
postcodes, hair colour of siblings, or number
moderate, bad, or jump, or height
of cars per household
levels of education
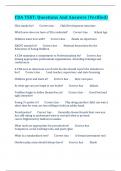
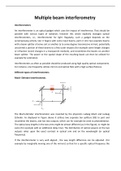
Which graph do I use?
Bar Chart
Categorical Frequency Table
Dot Plot
Bar Chart
Stem and Leaf
Boxplot
Numerical
Frequency Table
Interval Frequency Table
Dot Plot
Parallel Bar Chart
Comparing Categorical Two-way Frequency Table
Segmented Bar Chart
Back-to-Back Stem and Leaf
Comparing Numerical
Parallel Boxplot
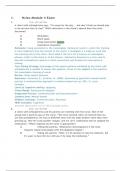
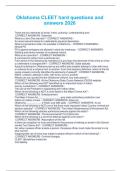
,Types of Graphs and When They Are Appropriate
Dot Plot
- Only one variable
- Categoric or numeric data
- Not good for large data sets
Bar Chart
- Only one variable
- Categoric or numeric data
- Most commonly Categoric
- Can be displayed horizontally or vertically
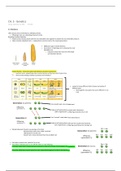
Frequency Table
Number of Frequency Eye Frequency
Siblings Colour
0 5
Blue 10
1 4 - Only one variable Brown 15
2 6 - Categoric or Numeric data Green 5
3 5 - Good for large data sets Total 30
Total 20
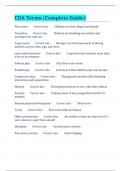
Interval Frequency Table
Class Frequen
Interva cy
l
100-
28
<150
150-
34
<200
200-
29
<250
250-
41
<300
Total 132
, - Only one variable
- Numeric data
- Data must be able to be divided into intervals
- 20-<30 includes values from 20 and up to but not including 30
- Good for large data sets
Histogram
- Only one variable
- Numeric data
- Data must be able to be divided into intervals
- Good for large data sets
- Data numbers at start and end of each coloumn to show intervals
Stem & Leaf Plot
- Only one variable
- Numeric Data
- Not good for large data sets
- Stems can be split into halves or fiths as
denoted by *
Back-to-back Stem & Leaf Plot
- Two variables
- One must be numeric, the other must have only two options – e.g. female and male, or
year 7 and year 12.
- You compare the numeric data from the two options
- Not good for large data sets
Boxplot
Univariate Data is data containing one variable
Types of
Data
Categorical Numerical
Ordinal
Discrete
Data that can be put Continuous
Nominal Data that can be
into an order or rank. Data that can be
Data with no sense of counted. (whole
e.g. survey with measured in decimals.
order. e.g. suburbs, numbers) e.g. number
responses good, e.g. distance in long
postcodes, hair colour of siblings, or number
moderate, bad, or jump, or height
of cars per household
levels of education
Which graph do I use?
Bar Chart
Categorical Frequency Table
Dot Plot
Bar Chart
Stem and Leaf
Boxplot
Numerical
Frequency Table
Interval Frequency Table
Dot Plot
Parallel Bar Chart
Comparing Categorical Two-way Frequency Table
Segmented Bar Chart
Back-to-Back Stem and Leaf
Comparing Numerical
Parallel Boxplot
,Types of Graphs and When They Are Appropriate
Dot Plot
- Only one variable
- Categoric or numeric data
- Not good for large data sets
Bar Chart
- Only one variable
- Categoric or numeric data
- Most commonly Categoric
- Can be displayed horizontally or vertically
Frequency Table
Number of Frequency Eye Frequency
Siblings Colour
0 5
Blue 10
1 4 - Only one variable Brown 15
2 6 - Categoric or Numeric data Green 5
3 5 - Good for large data sets Total 30
Total 20
Interval Frequency Table
Class Frequen
Interva cy
l
100-
28
<150
150-
34
<200
200-
29
<250
250-
41
<300
Total 132
, - Only one variable
- Numeric data
- Data must be able to be divided into intervals
- 20-<30 includes values from 20 and up to but not including 30
- Good for large data sets
Histogram
- Only one variable
- Numeric data
- Data must be able to be divided into intervals
- Good for large data sets
- Data numbers at start and end of each coloumn to show intervals
Stem & Leaf Plot
- Only one variable
- Numeric Data
- Not good for large data sets
- Stems can be split into halves or fiths as
denoted by *
Back-to-back Stem & Leaf Plot
- Two variables
- One must be numeric, the other must have only two options – e.g. female and male, or
year 7 and year 12.
- You compare the numeric data from the two options
- Not good for large data sets
Boxplot