Video Notes
Week 1: Data and Lean Six Sigma (LSS)
1.1 Introduction to Lean Six Sigma
Lean Six Sigma: a stepwise and data-driven approach to process improvement.
- Evidence-based and makes use of processed data.
3 Ways to use data:
- To diagnose the current process: what is the average and variation?
- To find the biggest problems you should focus on.
- To investigate the effect of improvements: are handling times improved through
training?
Process: series of actions or steps taken to make a product or deliver a service.
- It can occur in the industry, healthcare, service, etc.
- Every organization can be seen as a collection of processes.
3 Reasons to improve processes:
1. Withstand competition.
2. Adapt to higher customer expectations.
3. Technological innovations.
Examples of process improvement are to produce more per hour, decrease error, or lower
waiting times.
1.2 Data and DMAIC
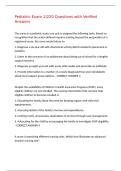
DMAIC: describe a stepwise procedure for process improvement.
Belt: project leader of a LSS project.
Define: Belt selects project and establishes objectives.
Measure: Belt makes the problem quantifiable and measurable. Note that you can’t
improve what you can’t measure.
Analyse: Belt analyses the current situation and makes a diagnosis to determine mayor
problem at hand.
Improve: Belt develops and implements improvement actions based on vital influence
factors. The effectiveness of proposed improvement actions must be
demonstrated (e.g., scatterplots).
Control: Belt improves process performance and closes the project. Statistical tools like
the two-sample t-test can be used for the before-and-after situation to show
the effectiveness of your project.
Data analytics is important in the different phases: Measure to collect measurements,
Analyse to analyse current performance, Improve to verify effectiveness of improvement
actions, Control to quantify results of your project.
1
,1.3 Selecting CTQs
Measure phase: making a problem measurable to reflect your project objective.
This is also the operationalization of your problem, as you need to relate the project
objectives to relevant process metrics.
A process takes more time, measure it by:
- Duration of set-up
- Start time production
Therefore, the process also runs worse on Mondays, measure it by:
- Amount of scrap per day
- Volume per day
➔ These four characteristics are your CTQs.
Critical To Quality (CTQ): a property of a process, product or service that is relevant to the
project objective. It’s your dependent (Y) variable, i.e., the outcome variable.
2 Questions to ask to find CTQs:
1. Which metric do I want to change?
2. Does that contribute to the success of the project?
Two different time variables:
Processing time: time it takes an employee to process something, for example the claim
➔ Personnel time often measured in minutes.
Throughput time: total duration of processing, for example the address change.
➔ Throughput time often measured in days.
1.4 Units and operational definition
Unit: the things you collect data on, including people, objects or phenomena.
- Also known as experimental unit, observational unit, unit of analysis, case, or subject.
Measurement unit: the properties of the things you collect data on – it defines what a
measurement means.
- For example: the unit is the vehicle, the measurement unit is kilometres per hour.
Operational definition: specify a sensible definition, one that captures the perceived
problem – and specify the CTQ, unit, and measurement unit. There is never one correct
operational definition, instead you should look for the most sensible definition.
- Example 1: measuring the delay of a train.
o Specify when a train is delayed -> after 3 minutes at arrival at large stations
along the route.
o CTQ = delay time, unit = arrival, measurement unit is the number of minutes a
train is delayed.
- Example 2: measuring the first-time fix rate (FTFR; % of calls an employee can handle
without putting the customer through to a different department).
o Specify
o CTQ = FTFR, unit = per employee per day, measurement unit = % of calls that
re handled the first time right.
2
, 1.5 Sampling
Reasons to use sampling:
- Difficult to get data on the entire population.
- Better precise information about a part of the population, than vague information
about the whole population.
The way to select the sample:
- Representative: selected ones are a good representation of the whole population.
- Sample should be based on a mechanism that is independent of the question.
Random sampling: each item in the population has equal chance of being selected.
- Ensures selected vehicles (example) are spread out evenly over types of vehicles.
- Spreads selected vehicles evenly over moments of the day.
➔ Never select ‘randomly’ manually! Ask a computer to do this for you.
Minitab 1. Make column with population of vehicles.
2. Make column with sample of vehicles.
3. Make population: Calc > Make patterned data > Simple set of numbers >
Fill in what column to store population > fill in first and last value.
4. Select random sample: Calc > Random Data > Sample from a column >
Rows = sample size, from = population, store = sample vehicles.
1.6 Organizing your data
Organize your data before analysing it. Do so on the basis of units (people, objects,
phenomena) and variables (measured properties).
Example
You work at the bank, and you are in charge of handling cross-border transactions.
Sometimes things go wrong – effects that affect your client – that will then reclaim.
Assign each reclaim a unique number regarding the particular claim. An indicator of service
quality (CTQ) is the total handling time of a reclaim. Collect the data on multiple reclaims.
Unit: a reclaim – there are 3 units above -> you can count the rows.
Variable: the property of unit you have measured -> you can count the columns.
Note: you need to know the unit of measurement to understand if the total time indicates
hours, days, weeks, etc.
1.7 Installing Minitab; 1.8 Introduction & 1.9 Loading data into Minitab
Minitab is a statistical software package. It is very easy to use and it can execute all statistical
calculations and matches excellently with LSS. It’s the industry-wide standard.
Minitab: to apply statistical tools to the data.
Excel: storing data and simple operations.
3
Week 1: Data and Lean Six Sigma (LSS)
1.1 Introduction to Lean Six Sigma
Lean Six Sigma: a stepwise and data-driven approach to process improvement.
- Evidence-based and makes use of processed data.
3 Ways to use data:
- To diagnose the current process: what is the average and variation?
- To find the biggest problems you should focus on.
- To investigate the effect of improvements: are handling times improved through
training?
Process: series of actions or steps taken to make a product or deliver a service.
- It can occur in the industry, healthcare, service, etc.
- Every organization can be seen as a collection of processes.
3 Reasons to improve processes:
1. Withstand competition.
2. Adapt to higher customer expectations.
3. Technological innovations.
Examples of process improvement are to produce more per hour, decrease error, or lower
waiting times.
1.2 Data and DMAIC
DMAIC: describe a stepwise procedure for process improvement.
Belt: project leader of a LSS project.
Define: Belt selects project and establishes objectives.
Measure: Belt makes the problem quantifiable and measurable. Note that you can’t
improve what you can’t measure.
Analyse: Belt analyses the current situation and makes a diagnosis to determine mayor
problem at hand.
Improve: Belt develops and implements improvement actions based on vital influence
factors. The effectiveness of proposed improvement actions must be
demonstrated (e.g., scatterplots).
Control: Belt improves process performance and closes the project. Statistical tools like
the two-sample t-test can be used for the before-and-after situation to show
the effectiveness of your project.
Data analytics is important in the different phases: Measure to collect measurements,
Analyse to analyse current performance, Improve to verify effectiveness of improvement
actions, Control to quantify results of your project.
1
,1.3 Selecting CTQs
Measure phase: making a problem measurable to reflect your project objective.
This is also the operationalization of your problem, as you need to relate the project
objectives to relevant process metrics.
A process takes more time, measure it by:
- Duration of set-up
- Start time production
Therefore, the process also runs worse on Mondays, measure it by:
- Amount of scrap per day
- Volume per day
➔ These four characteristics are your CTQs.
Critical To Quality (CTQ): a property of a process, product or service that is relevant to the
project objective. It’s your dependent (Y) variable, i.e., the outcome variable.
2 Questions to ask to find CTQs:
1. Which metric do I want to change?
2. Does that contribute to the success of the project?
Two different time variables:
Processing time: time it takes an employee to process something, for example the claim
➔ Personnel time often measured in minutes.
Throughput time: total duration of processing, for example the address change.
➔ Throughput time often measured in days.
1.4 Units and operational definition
Unit: the things you collect data on, including people, objects or phenomena.
- Also known as experimental unit, observational unit, unit of analysis, case, or subject.
Measurement unit: the properties of the things you collect data on – it defines what a
measurement means.
- For example: the unit is the vehicle, the measurement unit is kilometres per hour.
Operational definition: specify a sensible definition, one that captures the perceived
problem – and specify the CTQ, unit, and measurement unit. There is never one correct
operational definition, instead you should look for the most sensible definition.
- Example 1: measuring the delay of a train.
o Specify when a train is delayed -> after 3 minutes at arrival at large stations
along the route.
o CTQ = delay time, unit = arrival, measurement unit is the number of minutes a
train is delayed.
- Example 2: measuring the first-time fix rate (FTFR; % of calls an employee can handle
without putting the customer through to a different department).
o Specify
o CTQ = FTFR, unit = per employee per day, measurement unit = % of calls that
re handled the first time right.
2
, 1.5 Sampling
Reasons to use sampling:
- Difficult to get data on the entire population.
- Better precise information about a part of the population, than vague information
about the whole population.
The way to select the sample:
- Representative: selected ones are a good representation of the whole population.
- Sample should be based on a mechanism that is independent of the question.
Random sampling: each item in the population has equal chance of being selected.
- Ensures selected vehicles (example) are spread out evenly over types of vehicles.
- Spreads selected vehicles evenly over moments of the day.
➔ Never select ‘randomly’ manually! Ask a computer to do this for you.
Minitab 1. Make column with population of vehicles.
2. Make column with sample of vehicles.
3. Make population: Calc > Make patterned data > Simple set of numbers >
Fill in what column to store population > fill in first and last value.
4. Select random sample: Calc > Random Data > Sample from a column >
Rows = sample size, from = population, store = sample vehicles.
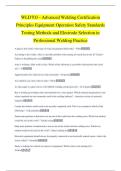
1.6 Organizing your data
Organize your data before analysing it. Do so on the basis of units (people, objects,
phenomena) and variables (measured properties).
Example
You work at the bank, and you are in charge of handling cross-border transactions.
Sometimes things go wrong – effects that affect your client – that will then reclaim.
Assign each reclaim a unique number regarding the particular claim. An indicator of service
quality (CTQ) is the total handling time of a reclaim. Collect the data on multiple reclaims.
Unit: a reclaim – there are 3 units above -> you can count the rows.
Variable: the property of unit you have measured -> you can count the columns.
Note: you need to know the unit of measurement to understand if the total time indicates
hours, days, weeks, etc.
1.7 Installing Minitab; 1.8 Introduction & 1.9 Loading data into Minitab
Minitab is a statistical software package. It is very easy to use and it can execute all statistical
calculations and matches excellently with LSS. It’s the industry-wide standard.
Minitab: to apply statistical tools to the data.
Excel: storing data and simple operations.
3