DEEL 1
Lijst van gebruikte symbolen in de statistiek
Naam Steekproef Populatie
Statistic Parameter
Gemiddelde X μ (mu)
Variance s2 σ2 (sigma kwadraat)
Standard deviation s σ (sigma)
Correlation r ρ (rho)
Covariance sX,Y sX,Y
Regressiecoëfficiënt b β (beta)
Proportion p̂ π
Range = Xmax – Xmin
Interquartile range = Q3 -Q1
(handig voor vaststellen van outliers)
Steekproefomvang n
Sum of Squares SS=∑(X− x̄ )²
Deviation score (afwijking gemiddelde) x - x̄
(Average deviation score is always 0)
Standaarddeviatie (standaardafwijking) sd(x)
, Correlation/Variance/Covariance
A measure of how spread out numbers are.
Correlation is a measure of relationship between two variables. There
are several relations involving variables such as: linear. When two sets of
data are strongly linked together we say they have a High Correlation.
The covariance measures the direction of the linear relationship
between two quantitative variables.
, Qualitative and Quantitative variables
Qualitative = non-numerical
Quantitative = numerical
Discrete variables are countable in a finite amount of time. For example,
you can count the change in your pocket. You can count the money in
your bank account. You could also count the amount of money
in everyone’s bank accounts. It might take you a long time to count that
last item, but the point is, it’s still countable.
Continuous Variables would take forever to count. For example, take
age. You can’t count “age” or ‘’time’’.
scale of measurement
Nominal (religion, blue eyes) weakest
Ordinal (t-shirt size, medals)
Interval (temperature, calendar)
Ratio (height, weight, time in seconds) strongest
No numerical calculations should be performed on nominal or ordinal data.
Nominal and ordinal scales use labels to classify observations into
different categories and the data resulting from these types of
measurement is qualitative in nature.
Interval and ratio scales use numerical values to quantify the size
of an observation and the data resulting from these types of
measurement is quantitative in nature.
,Using a nominal measurement, it is possible to detect
differences between two individuals, but no conclusions can be drawn
about the direction or size of the difference. As such, no mathematical
operations should be applied to data measured on a nominal level. This
severely limits the number of statistical techniques that can be used to
describe and analyse nominal data.
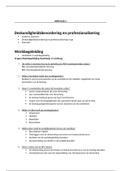
Detect Direction of Size of Calculate
differences? difference? difference? ratios?
(=,≠) (>,<) (+,−) (×,÷)
Nominal Yes No No No
Ordinal Yes Yes No No
Interval Yes Yes Yes No
Ratio Yes Yes Yes Yes
, Frequency Distributions
(tables, bar charts, histograms, and ogives)
Twee soorten statistiek:
Descriptief: beschrijvend, om patronen zichtbaar te maken in
ongeorganiseerde data
Inferentieel: analytisch, voor uitspraken die verder reiken dan de
verzamelde data
Een frequentieverdeling (Frequency Distributions) ordent een steekproef
door de waarnemingen (Observations) te rangschikken van de laagste
naar de hoogste score en alle waarnemingen met dezelfde score te
groeperen.
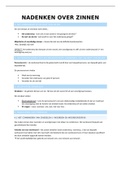
Normaalverdeling
Betrouwbaarheidsinterval:
95%
, There are three important properties of a frequency distribution:
Centrality
Variability
Shape
Centrality verwijst naar hoe een typische of gemiddelde score eruit ziet.
Variability heeft betrekking op het feit of de scores gegroepeerd zijn of
gelijkmatig zijn verdeeld.
De shape van een verdeling is gerelateerd aan de mate waarin een
verdeling symmetrisch of scheef is.
Central tendency
Central tendency is a statistical measure that is used to identify a single
score that describes the center of a distribution.
The purpose of central tendency is to find a typical or average score that
best represents the entire distribution.
Measures
Mode (modus)
The mode of a distribution is the most frequently occurring score
or category.
Median (mediaan)
The median is the midpoint of a distribution. It is the score that
divides the distribution into two equal halves.
Mean (gemiddelde)
Dividing the sum of the scores by the total number of
observations.
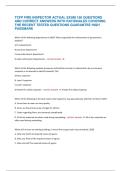
Nominal Ordinal Interval Ratio
Mode Yes Yes Yes Yes
Median No Yes Yes Yes
Mean No No Yes Yes
Lijst van gebruikte symbolen in de statistiek
Naam Steekproef Populatie
Statistic Parameter
Gemiddelde X μ (mu)
Variance s2 σ2 (sigma kwadraat)
Standard deviation s σ (sigma)
Correlation r ρ (rho)
Covariance sX,Y sX,Y
Regressiecoëfficiënt b β (beta)
Proportion p̂ π
Range = Xmax – Xmin
Interquartile range = Q3 -Q1
(handig voor vaststellen van outliers)
Steekproefomvang n
Sum of Squares SS=∑(X− x̄ )²
Deviation score (afwijking gemiddelde) x - x̄
(Average deviation score is always 0)
Standaarddeviatie (standaardafwijking) sd(x)
, Correlation/Variance/Covariance
A measure of how spread out numbers are.
Correlation is a measure of relationship between two variables. There
are several relations involving variables such as: linear. When two sets of
data are strongly linked together we say they have a High Correlation.
The covariance measures the direction of the linear relationship
between two quantitative variables.
, Qualitative and Quantitative variables
Qualitative = non-numerical
Quantitative = numerical
Discrete variables are countable in a finite amount of time. For example,
you can count the change in your pocket. You can count the money in
your bank account. You could also count the amount of money
in everyone’s bank accounts. It might take you a long time to count that
last item, but the point is, it’s still countable.
Continuous Variables would take forever to count. For example, take
age. You can’t count “age” or ‘’time’’.
scale of measurement
Nominal (religion, blue eyes) weakest
Ordinal (t-shirt size, medals)
Interval (temperature, calendar)
Ratio (height, weight, time in seconds) strongest
No numerical calculations should be performed on nominal or ordinal data.
Nominal and ordinal scales use labels to classify observations into
different categories and the data resulting from these types of
measurement is qualitative in nature.
Interval and ratio scales use numerical values to quantify the size
of an observation and the data resulting from these types of
measurement is quantitative in nature.
,Using a nominal measurement, it is possible to detect
differences between two individuals, but no conclusions can be drawn
about the direction or size of the difference. As such, no mathematical
operations should be applied to data measured on a nominal level. This
severely limits the number of statistical techniques that can be used to
describe and analyse nominal data.
Detect Direction of Size of Calculate
differences? difference? difference? ratios?
(=,≠) (>,<) (+,−) (×,÷)
Nominal Yes No No No
Ordinal Yes Yes No No
Interval Yes Yes Yes No
Ratio Yes Yes Yes Yes
, Frequency Distributions
(tables, bar charts, histograms, and ogives)
Twee soorten statistiek:
Descriptief: beschrijvend, om patronen zichtbaar te maken in
ongeorganiseerde data
Inferentieel: analytisch, voor uitspraken die verder reiken dan de
verzamelde data
Een frequentieverdeling (Frequency Distributions) ordent een steekproef
door de waarnemingen (Observations) te rangschikken van de laagste
naar de hoogste score en alle waarnemingen met dezelfde score te
groeperen.
Normaalverdeling
Betrouwbaarheidsinterval:
95%
, There are three important properties of a frequency distribution:
Centrality
Variability
Shape
Centrality verwijst naar hoe een typische of gemiddelde score eruit ziet.
Variability heeft betrekking op het feit of de scores gegroepeerd zijn of
gelijkmatig zijn verdeeld.
De shape van een verdeling is gerelateerd aan de mate waarin een
verdeling symmetrisch of scheef is.
Central tendency
Central tendency is a statistical measure that is used to identify a single
score that describes the center of a distribution.
The purpose of central tendency is to find a typical or average score that
best represents the entire distribution.
Measures
Mode (modus)
The mode of a distribution is the most frequently occurring score
or category.
Median (mediaan)
The median is the midpoint of a distribution. It is the score that
divides the distribution into two equal halves.
Mean (gemiddelde)
Dividing the sum of the scores by the total number of
observations.
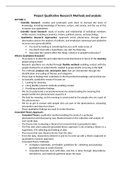
Nominal Ordinal Interval Ratio
Mode Yes Yes Yes Yes
Median No Yes Yes Yes
Mean No No Yes Yes