SAT – 1
DOCENTE - RAMFIS OMAR CENTENO RAMIREZ 1
, 𝟏
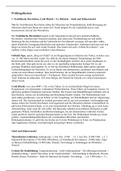
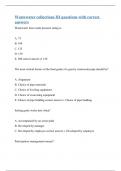
1. The function 𝒉 is defined by 𝒉(𝒙) = − 𝟒 𝒙 − 𝟐. Which is the graph of 𝒚 = 𝒉(𝒙)?
The most efficient strategy for identifying the correct graph is to calculate the points of intersection
(intercepts) with the axes of the Cartesian plane:
➢ x-intercept: To find this point, we assign a value of 0 to "y" in the function.
𝟏 𝟏
• By solving 𝟎 = − 𝟒 𝒙 − 𝟐, we get 𝟒 𝒙 = −𝟐, which results in 𝒙 = −𝟖.
➢ y-intercept: In this case, we replace the value of " x" with 0.
𝟏
• When calculating 𝒚 = − (𝟎) − 𝟐, the result is 𝒚 = −𝟐.
𝟒
Conclusion: Since the intercepts are (−𝟖, 𝟎) and (𝟎, −𝟐), it is confirmed that the correct graph
corresponds to option D.
Common Mistakes
• Slope Confusion: Choosing a graph with a positive slope (pointing upward) instead of
a negative one.
• Intercept Error: Confusing the y – Intercept (-2) with the x – Intercept (-8) when plotting
points on the plane.
DOCENTE - RAMFIS OMAR CENTENO RAMIREZ 2
DOCENTE - RAMFIS OMAR CENTENO RAMIREZ 1
, 𝟏
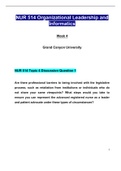
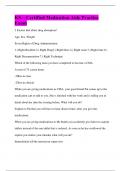
1. The function 𝒉 is defined by 𝒉(𝒙) = − 𝟒 𝒙 − 𝟐. Which is the graph of 𝒚 = 𝒉(𝒙)?
The most efficient strategy for identifying the correct graph is to calculate the points of intersection
(intercepts) with the axes of the Cartesian plane:
➢ x-intercept: To find this point, we assign a value of 0 to "y" in the function.
𝟏 𝟏
• By solving 𝟎 = − 𝟒 𝒙 − 𝟐, we get 𝟒 𝒙 = −𝟐, which results in 𝒙 = −𝟖.
➢ y-intercept: In this case, we replace the value of " x" with 0.
𝟏
• When calculating 𝒚 = − (𝟎) − 𝟐, the result is 𝒚 = −𝟐.
𝟒
Conclusion: Since the intercepts are (−𝟖, 𝟎) and (𝟎, −𝟐), it is confirmed that the correct graph
corresponds to option D.
Common Mistakes
• Slope Confusion: Choosing a graph with a positive slope (pointing upward) instead of
a negative one.
• Intercept Error: Confusing the y – Intercept (-2) with the x – Intercept (-8) when plotting
points on the plane.
DOCENTE - RAMFIS OMAR CENTENO RAMIREZ 2