CH6: Guest lectures: Introduction to network analytics
Representing data as a network
- Social media network: friends, likes, posts…
- Finding new materials
=> Unexpected applications
- Predicting who was going to be the new pope through networks => it was right
Introductory example
Königsberg
- 7 different bridges
- Question: can we walk across the city while crossing every bridge only exactly
once
- Euler: represented city as a network, tried to prove or disprove the possibility
- Was not possible: Every time you go in a part, you need to leave it as well so
all parts should all have all even or only two uneven
Network as mathematical concept: see slides
Types of networks
Directed network vs undirected
- Direction from b -> c possible but not other way
- Directions are not implied, both ways are possible
Weighted vs unweighted
- You have connections between people, but not all connections are as
important
- Higher weight can represent strength but also a distance
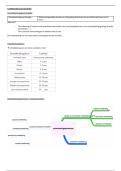
Homogeneous vs heterogeneous
- Do all nodes have the same type
- Bridges and boats for example
- In homogeneous only one type of node and edge
- Bipartite: Only connections between type 1 and 2, but never 1 and and 2
=> In projection possible to simplify and just connect the two type 1’s that are
connected through a type 2
- Node 1 degree after projection is 6, because trough A and C connected to 6
other numbers => not 2!
1
, Nodes/edge features
- Add additional information on the nodes and edges
- See example traintracks
Representing a network
Visualisation
- Intuitive for small networks
- Global structures can become visible
Mathematical representation
- More scalable
- Input algorithms
- Better analysis
Graph visualisations
Crucial when presenting analytical results (see slides)
A physical system of particles and springs
- Nodes: particles that repulse each other
- Edges: springs that pull nodes together
Iteratively move nodes to minimize the total “energy” of the system
- Find local minimum: equilibrium
- Hairball model
High dimensionality visualisation
- Dimension reduction method
- 2D map by preserving similarities => similar nodes close together in
representation
- Based on student-t distribution
- Using student-t pushes different clusters apart
- Handles non-linear relations
- Distance is meaningless and loss of explicit paths
- Sensitive to hyperparameters
Adjacency matrix
- mathematical representation
- Rows and columns are nodes, connections is edges
- nxn matrix, n is number of nodes
- see slides
- Put number of connections between the the row number and column number
in the cell
2
Representing data as a network
- Social media network: friends, likes, posts…
- Finding new materials
=> Unexpected applications
- Predicting who was going to be the new pope through networks => it was right
Introductory example
Königsberg
- 7 different bridges
- Question: can we walk across the city while crossing every bridge only exactly
once
- Euler: represented city as a network, tried to prove or disprove the possibility
- Was not possible: Every time you go in a part, you need to leave it as well so
all parts should all have all even or only two uneven
Network as mathematical concept: see slides
Types of networks
Directed network vs undirected
- Direction from b -> c possible but not other way
- Directions are not implied, both ways are possible
Weighted vs unweighted
- You have connections between people, but not all connections are as
important
- Higher weight can represent strength but also a distance
Homogeneous vs heterogeneous
- Do all nodes have the same type
- Bridges and boats for example
- In homogeneous only one type of node and edge
- Bipartite: Only connections between type 1 and 2, but never 1 and and 2
=> In projection possible to simplify and just connect the two type 1’s that are
connected through a type 2
- Node 1 degree after projection is 6, because trough A and C connected to 6
other numbers => not 2!
1
, Nodes/edge features
- Add additional information on the nodes and edges
- See example traintracks
Representing a network
Visualisation
- Intuitive for small networks
- Global structures can become visible
Mathematical representation
- More scalable
- Input algorithms
- Better analysis
Graph visualisations
Crucial when presenting analytical results (see slides)
A physical system of particles and springs
- Nodes: particles that repulse each other
- Edges: springs that pull nodes together
Iteratively move nodes to minimize the total “energy” of the system
- Find local minimum: equilibrium
- Hairball model
High dimensionality visualisation
- Dimension reduction method
- 2D map by preserving similarities => similar nodes close together in
representation
- Based on student-t distribution
- Using student-t pushes different clusters apart
- Handles non-linear relations
- Distance is meaningless and loss of explicit paths
- Sensitive to hyperparameters
Adjacency matrix
- mathematical representation
- Rows and columns are nodes, connections is edges
- nxn matrix, n is number of nodes
- see slides
- Put number of connections between the the row number and column number
in the cell
2