Package deal
MATH 534 Complete Course Project, Homework-Quiz, Discussions, Homework Problems, Quiz (Bundle)
MATH 534 Complete Course Project, Homework-Quiz, Discussions, Homework Problems, Quiz (Bundle)
Documents in this bundle
44
Other
MATH 534 Week 1 Addendum; Homework-Quiz Review
-
6
Jan 2023
2022/2023
$25.48
Other
MATH 534 Week 1 Discussion; Study and Sample Design (Keller)
-
8
Jan 2023
2022/2023
$18.48
Other
MATH 534 Week 1 Discussion; Study and Sample Design
-
74
Jan 2023
2022/2023
$18.48
Other
MATH 534 Week 1 Homework Problems
-
7
Jan 2023
2022/2023
$25.48
Exam (elaborations)
MATH 534 Week 1 Quiz
-
8
Jan 2023
2022/2023
$30.48
Exam (elaborations)
MATH 534 Week 2 Addendum; Homework-Quiz Review
-
3
Jan 2023
2022/2023
$25.48
Other
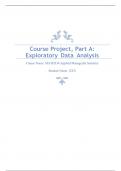
MATH 534 Week 2 Course Project, Part A - Exploratory Data Analysis
-
6
Jan 2023
2022/2023
$25.49


$430.48
$1,020.72
You save $590.24
Save 58% on 44 documents
100% satisfaction guarantee
Immediately available after payment
Both online and in PDF
No strings attached