Mathweek 5 Study guides, Class notes & Summaries
Looking for the best study guides, study notes and summaries about Mathweek 5? On this page you'll find 6 study documents about Mathweek 5.
All 6 results
Sort by
-
MATH 225N STATISTICS WEEK 6 FINAL EXAM 25 QUESTIONS WITH 100% CORRECT ANSWERS/ ACTUAL EXAM
- Exam (elaborations) • 26 pages • 2023
- $10.49
- + learn more
MATH 225N STATISTICS WEEK 6 FINAL EXAM 25 QUESTIONS WITH 100% CORRECT ANSWERS/ ACTUAL EXAM That is correct! Answer: ( 0.10, 0.18) That is correct! MATH 225N MATHWeek 6 Math 225n Statistics Week 6 Question 1 A statistics professor recently graded final exams for students in her introductory statistics course. In a review of her grading, she found the mean score out of 100 points was a x¯=77, with a margin of error of 10. Construct a confidence interval for the mean score (out of 100...

-
MATH 225N MATHWeek 5 Lab Assignment study guide
- Other • 4 pages • 2022
- $7.49
- + learn more
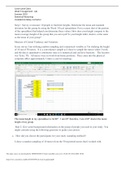
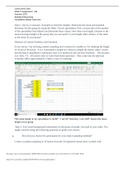
Step 1: Survey or measure 10 people to find their heights. Determine the mean and standard deviation for this group by using the Week 3 Excel spreadsheet. Post a screen shot of the portion of the spreadsheet that helped you determine these values. How does your height compare to the mean (average) height of the group that you surveyed? Is your height taller, shorter, or the same as the mean of your group? Measure of Central Tendency and Variation:
-
MATH 225N MATHWeek 5 Lab Assignment.pdf
- Other • 4 pages • 2021
- $14.49
- + learn more
Carol Lynne Cates Week 5 Assignment: Lab Summer 2019 Statistical Reasoning Varalakshmi Balaji, Instructor Step 1: Survey or measure 10 people to find their heights. Determine the mean and standard deviation for this group by using the Week 3 Excel spreadsheet. Post a screen shot of the portion of the spreadsheet that helped you determine these values. How does your height compare to the mean (average) height of the group that you surveyed? Is your height taller, shorter, or the same as ...
-
MATH 225N MATHWeek 5 Normal Distribution Discussion
- Other • 1 pages • 2022
- $7.49
- + learn more
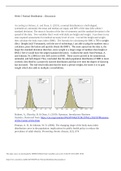
Week 5 Normal Distribution – Discussion

-
MATH 225N MATHWeek 5 Lab Assignment GRADED A+
- Exam (elaborations) • 5 pages • 2021
- $12.99
- + learn more
MATH 225N MATHWeek 5 Lab Assignment GRADED A+ MATH 225N MATHWeek 5 Lab Assignment GRADED A+ MATH 225N MATHWeek 5 Lab Assignment GRADED A+

Make study stress less painful

-
MATH 225N Week 5 Lab Assignment (Version 2) Summer 2019/2020, complete solution guide, Chamberlain.
- Exam (elaborations) • 4 pages • 2022
- $15.99
- + learn more
Step 1: Survey or measure 10 people to find their heights. Determine the mean and standard deviation for this group by using the Week 3 Excel spreadsheet. Post a screen shot of the portion of the spreadsheet that helped you determine these values. How does your height compare to the mean (average) height of the group that you surveyed? Is your height taller, shorter, or the same as the mean of your group? Measure of Central Tendency and Variation: In my survey I am utilizing random samplin...
