Ap statistic notes Study guides, Class notes & Summaries
Looking for the best study guides, study notes and summaries about Ap statistic notes? On this page you'll find 5 study documents about Ap statistic notes.
All 5 results
Sort by
-
Statistics A Tool For Social Researchers in Canada 4Th Ed by Steven Prus - Test Bank
- Exam (elaborations) • 102 pages • 2023
- $24.24
- + learn more
1. What is the purpose of measures of central tendency? a. to find the most typical value of a distribution of scores b. to find the most surprising value of a distribution of scores c. to find the most significant value of a distribution of scores d. to find the most important value of a distribution of scores ANSWER: a 2. Which of these statements describes the three commonly used measures of central tendency (mode, median, and mean)? a. They define “typical” or...
-
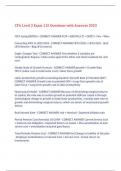
CFA Level 2 Exam 115 Questions with Answers 2023,100% CORRECT
- Exam (elaborations) • 15 pages • 2023
- $9.99
- + learn more
CFA Level 2 Exam 115 Questions with Answers 2023 FCFF (using EBITDA) - CORRECT ANSWER FCFF = EBIDTA(1-T) + DEP(T) - Finv - Winv Converting FIFO to LIFO COGS - CORRECT ANSWER FIFO COGS = LIFO COGS - (End LIFO Reserve - Beg LIFO reserve) Engle- Granger Test - CORRECT ANSWER Test whether 2 variables are cointegrated. Regress 1 data series against the other and check residuals for unit root. Steady State of Growth Formula - CORRECT ANSWER growth = Growth Rate TFP/1-(Labor cost in total...
-
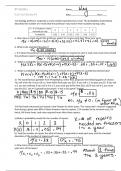
4.15-4.16 Review #1 KEY 2023
- Interview • 3 pages • 2024
- $7.99
- + learn more
AP Statistics notes delve into a comprehensive exploration of key statistical concepts, methodologies, and applications. The course begins with a solid foundation in descriptive statistics, where you learn to summarize and interpret data using measures of central tendency, dispersion, and graphical representations. This section includes discussions on histograms, box plots, and scatterplots to visually represent data patterns. Moving on to inferential statistics, your notes thoroughly cover p...
-
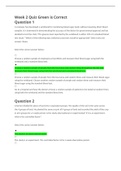
MATH 225N Statistics Quiz Week 2 (Correct Solutions) | 100% CORRECT.
- Exam (elaborations) • 17 pages • 2021
- $10.99
- + learn more
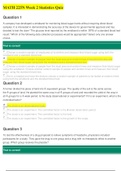
Question: A company has developed a wristband for monitoring blood sugar levels without requiring direct blood samples. It is interested in demonstrating the accuracy of the device for governmental ap proval and has decided to test the claim “The glucose level reported by the wristband is within 10%of a standard blood test result.” Which of the following data collection processes would be appropriate? Select only one answer choice. Question: A farmer divided his piece of land into 4equivalen...
-
MATH 225N Week 2 Statistics Quiz/{Grade A ++}
- Exam (elaborations) • 15 pages • 2021
- $10.99
- + learn more
Question: A company has developed a wristband for monitoring blood sugar levels without requiring direct blood samples. It is interested in demonstrating the accuracy of the device for governmental ap proval and has decided to test the claim “The glucose level reported by the wristband is within 10%of a standard blood test result.” Which of the following data collection processes would be appropriate? Select only one answer choice. Question: A farmer divided his piece of land into 4equivalen...

As you read this, a fellow student has made another $4.70

