Sophia statistics Study guides, Class notes & Summaries
Looking for the best study guides, study notes and summaries about Sophia statistics? On this page you'll find 1054 study documents about Sophia statistics.
Page 4 out of 1.054 results
Sort by
-
MAT 240 SOPHIA (Introduction to Statistics) UNIT 2 MILESTONE 2 QUESTIONS AND ANSWERS WITH RATIONALES VERIFIED by EXPERT (SNHU)
- Exam (elaborations) • 28 pages • 2024
- $15.99
- + learn more
MAT 240 SOPHIA (Introduction to Statistics) UNIT 2 MILESTONE 2 QUESTIONS AND ANSWERS WITH RATIONALES VERIFIED by EXPERT (SNHU
-
Sophia Statistics Unit 4 Milestone 4 / Score 15/18 Passed! Answers and rationales
- Exam (elaborations) • 18 pages • 2022
- $8.99
- + learn more
UNIT 4 — MILESTONE 4 Score 15/18 You passed this Milestone 15 questions were answered correctly. 3 questions were answered incorrectly. 1 The table below shows the grade and reading level for 5 students. Grade Reading Level Student 1 2 6 Student 2 6 14 Student 3 5 12 Student 4 4 10 Student 5 1 4 For grade, the mean is 3.6 and the standard deviation is 2.1. For reading level, the mean is 9.2 and the standard deviation is 4.1. Using the formula below or Excel, find the correlation...
-
Sophia Statistics Final Milestone.
- Exam (elaborations) • 22 pages • 2023
- $18.99
- + learn more
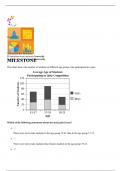
This chart shows the number of students of different age groups who participated in a quiz. Which of the following statements about the stack plot is true? There were more male students in the age group 19-21 than in the age group 15-17. There were more male students than female students in the age group 19-21. There were more female students in the age group 17-19 than in any other age group. There were more students in the age group 15-17 than in any other age group. RATIONALE ...

-
Sophia Statistics Unit 5 Milestone,..pdf
- Exam (elaborations) • 22 pages • 2023
- $14.48
- + learn more
Sophia Statistics Unit 5 Milestone,..pdf
-
MAT 240 UNIT 4 MILESTONE 4 SOPHIA INTRODUCTION TO STATISTICS SNHU
- Exam (elaborations) • 33 pages • 2024
- $15.39
- + learn more
MAT 240 UNIT 4 MILESTONE 4 SOPHIA INTRODUCTION TO STATISTICS SNHU

As you read this, a fellow student has made another $4.70

-
Sophia Statistics Final Milestone 2 (Complete) Latest Review 2023 Practice Questions and Answers, 100% Correct with Explanations, Highly Recommended, Download to Score A+
- Exam (elaborations) • 21 pages • 2023
- $17.99
- + learn more
Sophia Statistics Final Milestone 2 (Complete) Latest Review 2023 Practice Questions and Answers, 100% Correct with Explanations, Highly Recommended, Download to Score A+ Which of the following statements about the stack plot is true? There were more male students in the age group 19-21 than in the age group 15-17. There were more male students than female students in the age group 19-21. There were more female students in the age group 17-19 than in any other age group. There were more stu...

-
STATISTICS MISC - SOPHIA STATISTICS UNIT 5 – MILESTONE 5 LATEST 2023
- Exam (elaborations) • 22 pages • 2023
- $18.49
- + learn more
STATISTICS MISC - SOPHIA STATISTICS UNIT 5 – MILESTONE 5 LATEST 2023

-
STATISTICS MISC - SOPHIA STATISTICS UNIT 5 – MILESTONE 5 LATEST 2023
- Exam (elaborations) • 22 pages • 2023
- $18.49
- + learn more
STATISTICS MISC - SOPHIA STATISTICS UNIT 5 – MILESTONE 5 LATEST 2023
-
STATISTICS MISC - SOPHIA STATISTICS UNIT 5 – MILESTONE 5 LATEST 2023 STATISTICS MISC UNIT 5– MILESTONE 5
- Exam (elaborations) • 22 pages • 2023
- $13.99
- + learn more
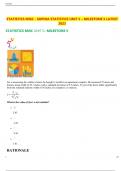
STATISTICS MISC - SOPHIA STATISTICS UNIT 5 – MILESTONE 5 LATEST 2023 STATISTICS MISC UNIT 5– MILESTONE 5 You passed this Milestone Joe is measuring the widths of doors he bought to install in an apartment complex. He measured 72 doors and found a mean width of 36.1 inches with a standard deviation of 0.3 inches. To test if the doors differ significantly from the standard industry width of 36 inches, he computes a z-statistic. What is the value of Joe's z-test statistic? 2.83 -1.81...
-
Sophia Statistics Unit 1 Milestone-2023
- Exam (elaborations) • 19 pages • 2023
- $12.99
- + learn more
Sophia Statistics Unit 1 Milestone-2023
