Frankfort nachmias Study guides, Class notes & Summaries
Looking for the best study guides, study notes and summaries about Frankfort nachmias? On this page you'll find 60 study documents about Frankfort nachmias.
Page 2 out of 60 results
Sort by
-
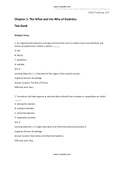
Social Statistics for a Diverse Society 9th Edition Frankfort-Nachmias Test Bank
- Exam (elaborations) • 260 pages • 2022
- $16.16
- + learn more
Social Statistics for a Diverse Society 9th Edition Frankfort-Nachmias Test Bank . Instant download .
-
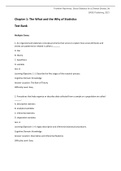
Social Statistics for a Diverse Society 9th Edition Frankfort-Nachmias Test Bank
- Exam (elaborations) • 258 pages • 2022
- $26.42
- + learn more
Social Statistics for a Diverse Society 9th Edition Frankfort-Nachmias Test Bank - Instant Download

-
INTRODUCTION TO QUANTITATIVE ANALYSIS: CONFIDENCE INTERVALSEDD P-20 Walden UniversityRSCH-
- Summary • 3 pages • 2024
- $7.99
- + learn more
RSCH-8210D-4 INTRODUCTION TO QUANTITATIVE ANALYSISINTRODUCTION TO QUANTITATIVE ANALYSIS: CONFIDENCE INTERVALSEDD P-20 Walden UniversityRSCH-8210D-4Confidence Intervals Frankfort-Nachmias et al. (2020), discussed that confidence intervals (CIs) are a fundamental tool in statistical analysis, the concept of CIs as ranges of values calculated from sample data that are used to estimate the true value of a population parameter, such as a mean or proportion, with a certain level of confidence. The exp...
-
Wk7AssgnDraytonS.docx
- Summary • 4 pages • 2022
- $7.49
- + learn more
Wk7AssgnDraytonS.docx Assignment: Testing for One-Way ANOVA RSCH 8210 A-Quantitative Reasoning and Analysis Walden University 14:48:29 GMT -05:00 According to Frankfort-Nachmias & Leon- Guerrero (2018) the analysis of variance (ANOVA) is a research testing tool used to test for significant relationships between two variables in two or more group samples. To conduct the ANOVA test, the High School Longitudinal Study (2009) was used along with two selected variables. The dependent variable...
-
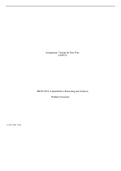
WK1AssgnSessionWillisB.docx Variables, Measurement, and SPSS RSCH 8210: Quantitative Reasoning Module 1 14:03:25 GMT -05:00 Variables, Measurement, and SPSS For this assignment, the researcher analyzed the Afrobarometer dataset. To identify the m
- Summary • 4 pages • 2022
- $7.49
- + learn more
WK1AssgnSessionWillisB.docx Variables, Measurement, and SPSS RSCH 8210: Quantitative Reasoning Module 1 14:03:25 GMT -05:00 Variables, Measurement, and SPSS For this assignment, the researcher analyzed the Afrobarometer dataset. To identify the mean of Q1 (Age), the researcher set SPSS to Variable View, selected Q1, and ran the descriptive statistics. The results displayed the mean of Q1 (Age) as 37.17. In this dataset, the researcher chose the variables Q101 (Gender of respondents) and...

Want to regain your expenses?

-
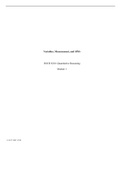
Wk2AssignTedrowW.docx 1 Visually Displaying Data Results Walden University RSCH 8210: Quantitative Reasoning and Analysis 14:08:14 GMT -05:00 Visually Displaying Data Results Categorical Variable Using the Afrobarometer data set, with a mean age
- Summary • 4 pages • 2022
- $7.49
- + learn more
Wk2AssignTedrowW.docx 1 Visually Displaying Data Results Walden University RSCH 8210: Quantitative Reasoning and Analysis 14:08:14 GMT -05:00 Visually Displaying Data Results Categorical Variable Using the Afrobarometer data set, with a mean age of 37.23, the first variable selected for visual display is the Urban or Rural Primary Sampling Unit. This is a categorical variable because all responses fall into urban, rural, or semi-urban categories. Each response carries the same weight ma...
-
Wk3AssignTedrowW.docx 1 Descriptive Analysis Walden University RSCH 8210: Quantitative Reasoning and Analysis 14:09:01 GMT -05:00 Descriptive Analysis The quantitative descriptive analysis is completed using the Afrobarometer data set with a mean
- Summary • 4 pages • 2022
- $7.49
- + learn more
Wk3AssignTedrowW.docx 1 Descriptive Analysis Walden University RSCH 8210: Quantitative Reasoning and Analysis 14:09:01 GMT -05:00 Descriptive Analysis The quantitative descriptive analysis is completed using the Afrobarometer data set with a mean age of 37.23. The categorical variable selected is Urban or Rural Primary Sampling Unit. The continuous variable selected is the Infrastructure Index. Categorical Variable The variable Urban or Rural Primary Sampling Unit uses a nomi...
-
Wk8AssignTedrowW.docx Testing for Correlation & Bivariate Regression Walden University RSCH 8210: Quantitative Reasoning and Analysis 14:08:12 GMT -05:00 Testing for Correlation & Bivariate Regression Self-efficacy is critical for teachers to pro
- Summary • 4 pages • 2022
- $7.49
- + learn more
Wk8AssignTedrowW.docx Testing for Correlation & Bivariate Regression Walden University RSCH 8210: Quantitative Reasoning and Analysis 14:08:12 GMT -05:00 Testing for Correlation & Bivariate Regression Self-efficacy is critical for teachers to provide effective instruction. How does the number of years a math teacher has taught predict the instructor's degree of self-efficacy? The High School Long Survey data set, with a mean X1SES of .0549, will be used to answer this research question...

-
Social Statistics for a Diverse Society 9th Edition Frankfort-Nachmias Test Bank
- Exam (elaborations) • 340 pages • 2024
- $25.49
- + learn more
Social Statistics for a Diverse Society 9th Edition Frankfort-Nachmias Test Bank
-
Social Statistics for a Diverse Society 9th Edition Frankfort-Nachmias Test Bank
- Exam (elaborations) • 340 pages • 2024
- $25.49
- + learn more
Social Statistics for a Diverse Society 9th Edition Frankfort-Nachmias Test Bank
