STAT 200: Introduction to Statistics (STAT 200)
University Of Maryland - College Park
All 4 results
Sort by
-
STAT 200 Week 3 Homework Problems - STAT200 Week 3: Introduction To Statistics Quiz
- Exam (elaborations) • 5 pages • 2021
- $15.50
- + learn more
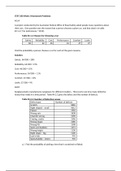
STAT 200 Week 3 Homework Problems 4.1.4 A project conducted by the Australian Federal Office of Road Safety asked people many questions about their cars. One question was the reason that a person chooses a given car, and that data is in table #4.1.4 ("Car preferences," 2013). Table #4.1.4: Reason for Choosing a Car Safety Reliability Cost Performance Comfort Looks 84 62 46 34 47 27 Find the probability a person chooses a car for each of the given reasons. Solution: Safety: 84/300 ...
-
STAT 200 Week 7 Homework Problems - STAT200 Week 7: Introduction To Statistics Quiz
- Exam (elaborations) • 9 pages • 2021
- $15.40
- + learn more
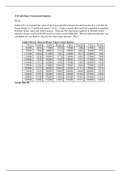
STAT 200 Week 7 Homework Problems 10.1.2 Table #10.1.6 contains the value of the house and the amount of rental income in a year that the house brings in ("Capital and rental," 2013). Create a scatter plot and find a regression equation between house value and rental income. Then use the regression equation to find the rental income a house worth $230,000 and for a house worth $400,000. Which rental income that you calculated do you think is closer to the true rental income? Why? Table ...
-
STAT 200 Week 4 Homework Problems - STAT200 Week 4: Introduction To Statistics Quiz
- Exam (elaborations) • 5 pages • 2021
- $15.20
- + learn more
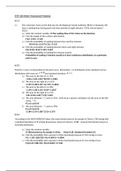
STAT 200 Week 4 Homework Problems 6.1.2 ⦁ The commuter trains on the Red Line for the Regional Transit Authority (RTA) in Cleveland, OH, have a waiting time during peak rush hour periods of eight minutes ("2012 annual report," 2012). ⦁ State the random variable. X=The waiting time of the trains on the Red Line ⦁ Find the height of this uniform distribution. F(x)= 1/8-0 = 0.125 ⦁ Find the probability of waiting between four and five minutes. P(4<X<5)= (5-4)*0.125 = 0.125...
-
STAT 200: Introduction to Statistics Final Exam_Verified Answers;Graded A+
- Exam (elaborations) • 10 pages • 2020
- $20.98
- + learn more
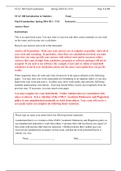
This is an open-book exam. You may refer to your text and other course materials as you work on the exam, and you may use a calculator. You must complete the exam individually. Neither collaboration nor consultation with others is allowed. It is a violation of the UMUC Academic Dishonesty and Plagiarism policy to use unauthorized materials or work from others. Answer all 20 questions. Make sure your answers are as complete as possible. Show all of your work and reasoning. In particular...

Fear of missing out? Then don’t!

