STAT200 Descriptive Statistics Analysis (STA200)
University Of Maryland University College Fort Sam Houston
All 3 results
Sort by
-
STA200-2019-Assignment 2 Descriptive Statistics Data Analysis Plan.
- Exam (elaborations) • 7 pages • 2021
- $17.49
- + learn more
Description of Findings. The median is 96907 and the standard deviation is 6402.215. The standard deviation is high which means there is a difference on incomes of the sample. The annual household income variable reveals a median income of $96907. Based on the histogram, many families earn an income that ranges from $94,867 and $102,067Use the same scenario you submitted for the first assignment with modifications using your instructor’s feedback, if needed. Include Table 1: Variables Selected...
-
STA200-2019-Assignment1 Descriptive Statistics Data Analysis Plan.pdf
- Exam (elaborations) • 5 pages • 2021
- $17.49
- + learn more
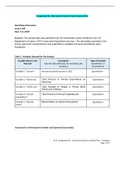
Scenario: The sample data was gathered from 30 households chosen randomly from US Department of Labor’s 2016 Consumer Expenditure Surveys. The information provided in the survey were both socioeconomic and expenditure variables that were provided by each householdVariable 1: “Income” – It’s very important to know the family income before making any financial plan. All expenditures can be planned once the income is known. Being a quantitative variable, it’s easy to perform statistical...
-
STAT200-2020- Introduction to Statistics-Final Examination-Awnsers 100%
- Exam (elaborations) • 14 pages • 2021
- $15.49
- + learn more
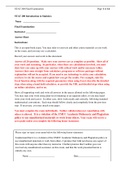
tification A and Ac ( complement of A) share no common region , and thus P(A AND Ac ) = 0. Therefore the statement is true (b). If the variance of a data set is 0, then all the observations in this data set must be zero. Justification Variance is usually the expectation or mean of the squared deviation of a random variable from its mean. If the variance is zero, the squared deviations must be zero and thus the mean must be equal to every value. So , a variance of zero implies the observations ar...

Want to regain your expenses?

