Chamberlain College of Nursing • Chamberlain College of Nursing
Latest uploads for Chamberlain College of Nursing at Chamberlain College of Nursing. Looking for Chamberlain College of Nursing notes at Chamberlain College of Nursing? We have lots of notes, study guides and study notes available for Chamberlain College of Nursing at Chamberlain College of Nursing.
-
574
- 0
-
69
Courses Chamberlain College of Nursing at Chamberlain College of Nursing
Notes available for the following courses of Chamberlain College of Nursing at Chamberlain College of Nursing
-
ATI PN Comprehensive Exit Exam 1
-
Calculation of Drug Dosages . 1
-
CHEM 120 CHEM 120 33
-
Essentials Of Anatomy And Physiology 7th Edition Lapres Test Bank. 1
-
FIN 565 FIN565 13
-
Focus on Nursing Pharmacology. 1
-
Globalization of World Politics. 1
-
Hamric and Hanson’s Advanced Practice Nursing An Integrative Approach 6th Edition Tracy O’Grady Test Bank 1
-
Health Informatics 2nd Edition Nelson Staggers Test Bank 1
-
HIST 405N HIST 405N 25
-
HIST 410N IST 410N 22
-
HIST410N Contemporary History HIST410N Contemporary History 4
-
INTRODUCTION TO HEALTH RESEARCH METHODS . 1
-
MATH 225N MATH225N 70
-
MIS 581 MIS581 30
-
MIS589 MIS589 5
-
NR 103 NR103 14
-
NR 324 ADULT HEALTH 1 STUDY GUIDE 1
-
NR 328 Pediatric Nursing NR 328 1
-
NR 360 NR360 31
-
NR 361 NR 361 14
-
NR 394 NR394 22
-
NR 500 NR500 25
-
NR 503 NR503 44
-
NR 503 Population Health, Epidemiology & Statistical Principles NR 503 4
-
NR 506 NR506 17
-
NR 509 / NR509 Advanced Physical Assessment 1
-
NR 531 NR531 14
-
NR 536 NR 536 17
-
NR 565 NR565 36
-
NR 566 NR566 37
-
NR 601 NR601 9
-
NR103 NR103 30
-
NR452 NR452 1
-
Nursing NR565 20
-
PHIL 347 PHIL 347 19
-
Success in Practical Vocational . 1
-
Summary review Notes for exam preparations Complex Adult Health 1
-
Test Bank Burns And Grove The Practice Of Nursing Research 9th Edition Gray Grove 1
-
Theoretical Basis For Nursing 5th Edition McEwen Wills Test Bank 1
-
Therapeutic Exercise For Musculoskeletal Injuries 4th Edition Houglum Test Bank 1
-
Transcultural Nursing Assessment and Intervention 8th Edition Giger Test Bank 1
-
Wong’s Essentials Of Pediatric Nursing 11th Edition Hockenberry Rodgers Wilson Test Bank 1
Latest notes & summaries Chamberlain College of Nursing • Chamberlain College of Nursing
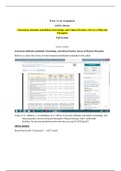
Scenario/Summary This week's lab highlights the use of graphics, distributions, and tables to summarize and interpret data. Follow the directions below to find one of the given academic articles from the Chamberlain library and then use that to describe the graphs and tables included. Further, you will describe other ways that the same data could be presented. Deliverables The deliverable is a Word document with your answers to the questions posed below based on the article you find. Required So...
- Package deal
- Other
- • 5 pages's •
-
Chamberlain College Of Nursing•MATH 225N
-
MATH 225N Complete Week 3 (Bundle)• ByMilestonee
Preview 1 out of 5 pages
Scenario/Summary This week's lab highlights the use of graphics, distributions, and tables to summarize and interpret data. Follow the directions below to find one of the given academic articles from the Chamberlain library and then use that to describe the graphs and tables included. Further, you will describe other ways that the same data could be presented. Deliverables The deliverable is a Word document with your answers to the questions posed below based on the article you find. Required So...
Scenario/Summary This week's lab highlights the use of graphics, distributions, and tables to summarize and interpret data. Follow the directions below to find one of the given academic articles from the Chamberlain library and then use that to describe the graphs and tables included. Further, you will describe other ways that the same data could be presented. Deliverables The deliverable is a Word document with your answers to the questions posed below based on the article you find. Required So...
- Package deal
- Other
- • 6 pages's •
-
Chamberlain College Of Nursing•MATH 225N
-
MATH 225N Complete Week 3 (Bundle)• ByMilestonee
Preview 1 out of 6 pages
Scenario/Summary This week's lab highlights the use of graphics, distributions, and tables to summarize and interpret data. Follow the directions below to find one of the given academic articles from the Chamberlain library and then use that to describe the graphs and tables included. Further, you will describe other ways that the same data could be presented. Deliverables The deliverable is a Word document with your answers to the questions posed below based on the article you find. Required So...
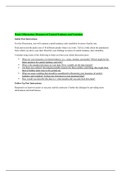
Initial Post Instructions For this Discussion, you will examine central tendency and variability in terms of pulse rate. Find and record the pulse rate of 10 different people where you work. Tell us a little about the population from which you drew your data. Describe your findings in terms of central tendency and variability. Consider using some of the following to help you form your initial discussion post: • What are your measures of central tendency (i.e., mean, median, and mode)? Which mi...
- Package deal
- Other
- • 3 pages's •
-
Chamberlain College Of Nursing•MATH 225N
-
MATH 225N Complete Week 3 (Bundle)• ByMilestonee
Preview 1 out of 3 pages
Initial Post Instructions For this Discussion, you will examine central tendency and variability in terms of pulse rate. Find and record the pulse rate of 10 different people where you work. Tell us a little about the population from which you drew your data. Describe your findings in terms of central tendency and variability. Consider using some of the following to help you form your initial discussion post: • What are your measures of central tendency (i.e., mean, median, and mode)? Which mi...
Scenario/Summary This week's lab highlights the use of graphics, distributions, and tables to summarize and interpret data. Follow the directions below to find one of the given academic articles from the Chamberlain library and then use that to describe the graphs and tables included. Further, you will describe other ways that the same data could be presented. Deliverables The deliverable is a Word document with your answers to the questions posed below based on the article you find. Required So...
- Package deal
- Other
- • 3 pages's •
-
Chamberlain College Of Nursing•MATH 225N
-
MATH 225N Complete Week 3 (Bundle)• ByMilestonee
Preview 1 out of 3 pages
Scenario/Summary This week's lab highlights the use of graphics, distributions, and tables to summarize and interpret data. Follow the directions below to find one of the given academic articles from the Chamberlain library and then use that to describe the graphs and tables included. Further, you will describe other ways that the same data could be presented. Deliverables The deliverable is a Word document with your answers to the questions posed below based on the article you find. Required So...
Scenario/Summary This week's lab highlights the use of graphics, distributions, and tables to summarize and interpret data. Follow the directions below to find one of the given academic articles from the Chamberlain library and then use that to describe the graphs and tables included. Further, you will describe other ways that the same data could be presented. Deliverables The deliverable is a Word document with your answers to the questions posed below based on the article you find. Required So...
- Package deal
- Other
- • 5 pages's •
-
Chamberlain College Of Nursing•MATH 225N
-
MATH 225N Complete Week 3 (Bundle)• ByMilestonee
Preview 1 out of 5 pages
Scenario/Summary This week's lab highlights the use of graphics, distributions, and tables to summarize and interpret data. Follow the directions below to find one of the given academic articles from the Chamberlain library and then use that to describe the graphs and tables included. Further, you will describe other ways that the same data could be presented. Deliverables The deliverable is a Word document with your answers to the questions posed below based on the article you find. Required So...
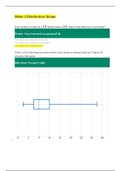
1. Question:If the median of a data set is 13 and the mean is 13, which of the following is most likely? 2. Question:Which of the following box-and-whisker plots shows a skewed data set? Select all answers that apply. • A horizontal box-and-whisker plot is above a horizontal axis labeled from 0 to 16 in increments of 2. The box-and-whisker plot has the following five-number summary: 1, 3, 4, 6, and 15. All values are approximate. The part of the box at point 4 is represented with a dotted line...
- Package deal
- Other
- • 9 pages's •
-
Chamberlain College Of Nursing•MATH 225N
-
MATH 225N Complete Week 3 (Bundle)• ByMilestonee
Preview 1 out of 9 pages
1. Question:If the median of a data set is 13 and the mean is 13, which of the following is most likely? 2. Question:Which of the following box-and-whisker plots shows a skewed data set? Select all answers that apply. • A horizontal box-and-whisker plot is above a horizontal axis labeled from 0 to 16 in increments of 2. The box-and-whisker plot has the following five-number summary: 1, 3, 4, 6, and 15. All values are approximate. The part of the box at point 4 is represented with a dotted line...
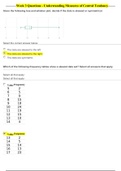
1. Question: Given the following box-and-whisker plot, decide if the data is skewed or symmetrical. Select the correct answer below: 2. Question: Which of the following frequency tables show a skewed data set? Select all answers that apply. Select the correct answer below: 3. Question: Which of the following frequency tables show a skewed data set? Select all answers that apply. 4. Question: Which of the following frequency tables shows a skewed data set? Select all answers that apply. 5. Questi...
- Package deal
- Other
- • 27 pages's •
-
Chamberlain College Of Nursing•MATH 225N
-
MATH 225N Complete Week 3 (Bundle)• ByMilestonee
Preview 1 out of 27 pages
1. Question: Given the following box-and-whisker plot, decide if the data is skewed or symmetrical. Select the correct answer below: 2. Question: Which of the following frequency tables show a skewed data set? Select all answers that apply. Select the correct answer below: 3. Question: Which of the following frequency tables show a skewed data set? Select all answers that apply. 4. Question: Which of the following frequency tables shows a skewed data set? Select all answers that apply. 5. Questi...
Scenario/Summary This week's lab highlights the use of graphics, distributions, and tables to summarize and interpret data. Follow the directions below to find one of the given academic articles from the Chamberlain library and then use that to describe the graphs and tables included. Further, you will describe other ways that the same data could be presented. Deliverables The deliverable is a Word document with your answers to the questions posed below based on the article you find. Required So...
- Package deal
- Other
- • 6 pages's •
-
Chamberlain College Of Nursing•MATH 225N
-
MATH 225N Complete Week 3 (Bundle)• ByMilestonee
Preview 1 out of 6 pages
Scenario/Summary This week's lab highlights the use of graphics, distributions, and tables to summarize and interpret data. Follow the directions below to find one of the given academic articles from the Chamberlain library and then use that to describe the graphs and tables included. Further, you will describe other ways that the same data could be presented. Deliverables The deliverable is a Word document with your answers to the questions posed below based on the article you find. Required So...
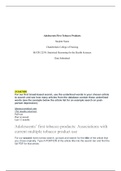
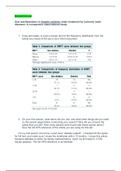
1. Question: A company has developed a wristband for monitoring blood sugar levels without requiring direct blood samples. It is interested in demonstrating the accuracy of the device for governmental approval and has decided to test the claim "The glucose level reported by the wristband is within 10% of a standard blood test result." Which of the following data collection processes would be appropriate? Select only one answer choice. 2. Question: A farmer divided his piece of land into 4 equiva...
- Package deal
- Other
- • 12 pages's •
-
Chamberlain College Of Nursing•MATH 225N
-
MATH 225N Complete Week 2 (Bundle)• ByMilestonee
Preview 1 out of 12 pages
1. Question: A company has developed a wristband for monitoring blood sugar levels without requiring direct blood samples. It is interested in demonstrating the accuracy of the device for governmental approval and has decided to test the claim "The glucose level reported by the wristband is within 10% of a standard blood test result." Which of the following data collection processes would be appropriate? Select only one answer choice. 2. Question: A farmer divided his piece of land into 4 equiva...
Required Resources Read/review the following resources for this activity: OpenStax Book: Chapter 2.. Section 2.1 Lesson Minimum of 1 scholarly source In your reference for this assignment, be sure to include both your text/class materials AND your outside reading(s). Initial Post Instructions Suppose that you have two sets of data to work with. The first set is a list of all the injuries that were seen in a clinic in a month's time. The second set contains data on the number of minutes that ea...
- Package deal
- Other
- • 4 pages's •
-
Chamberlain College Of Nursing•MATH 225N
-
MATH 225N Complete Week 2 (Bundle)• ByMilestonee
Preview 1 out of 4 pages
Required Resources Read/review the following resources for this activity: OpenStax Book: Chapter 2.. Section 2.1 Lesson Minimum of 1 scholarly source In your reference for this assignment, be sure to include both your text/class materials AND your outside reading(s). Initial Post Instructions Suppose that you have two sets of data to work with. The first set is a list of all the injuries that were seen in a clinic in a month's time. The second set contains data on the number of minutes that ea...