Andy Field’s Discovering Statistics using IBM SPSS Statistics
Chapter 1.1 – 1.5
This chapter is concerned with showing that statistics are important for doing research. We will
overview the whole research process, from why we conduct research in the first place through how
theories are generated, to why we need data to test these theories. It teaches you how to analyse data.
To answer questions you need: data, and an explanation for those data. When numbers are involved
the research involves quantitative research. The research process is summarized in Figure 1.2.
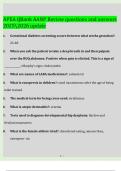
- Figure 1.2 – The research process
You begin with an observation you want to understand. From your initial observation you generate
explanations, or theories, for those observations, from which you make predictions (hypotheses). To
test your predictions you need data. First you collect some relevant data (and to do that you need to
identify things that can be measures) and then you analyse those data. The analysis of data may
support your theory or give you cause to modify the theory.
The processes of data collection and analysis and generating theories are intrinsically linked:
theories lead to data collection/analysis and data collection/analysis informs theories. Scientific
statements (hypotheses) can be confirmed or disconfirmed empirically. The variables concerned can
be quantified and measured.
Initial observation: finding something that needs explaining
A lot of scientific endeavour starts by observing something in the world and wondering why it
happens. Having made a causal observation about the world, I need to collect some data to see
whether this observation is true (and not a biased observation). To do this, I need to define one or
more variables that I would like to measure. Example: many Big Brother contestants have unpleasant
personalities, they seem to have narcissistic personality disorder.
Generating theories and testing them
The next thing to do is explain these data. One explanation could be that people with narcissistic
personality disorder are more likely to audition for Big Brother than those with out. Another
possibility is that the producers of BB are more likely to select people who have NPD to be contestants
than those without. These are two theories. We verified our original observation by collecting data,
and we can collect more data to test theories. We can make two predictions from the theories, known
as hypotheses.
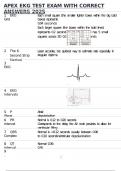
The first is that the number of people auditioning with NPD will be higher than the general level in the
population. We could test this by getting a team of psychologists to interview each person at the BB
audition and diagnose them as having NPD or not. A prediction from the second theory is that if the
BB selection panel are more likely to choose people with NPD then the rate in the group of people
going for auditions. These data are in Table 1.1.
Chapter 1.1 – 1.5
This chapter is concerned with showing that statistics are important for doing research. We will
overview the whole research process, from why we conduct research in the first place through how
theories are generated, to why we need data to test these theories. It teaches you how to analyse data.
To answer questions you need: data, and an explanation for those data. When numbers are involved
the research involves quantitative research. The research process is summarized in Figure 1.2.
- Figure 1.2 – The research process
You begin with an observation you want to understand. From your initial observation you generate
explanations, or theories, for those observations, from which you make predictions (hypotheses). To
test your predictions you need data. First you collect some relevant data (and to do that you need to
identify things that can be measures) and then you analyse those data. The analysis of data may
support your theory or give you cause to modify the theory.
The processes of data collection and analysis and generating theories are intrinsically linked:
theories lead to data collection/analysis and data collection/analysis informs theories. Scientific
statements (hypotheses) can be confirmed or disconfirmed empirically. The variables concerned can
be quantified and measured.
Initial observation: finding something that needs explaining
A lot of scientific endeavour starts by observing something in the world and wondering why it
happens. Having made a causal observation about the world, I need to collect some data to see
whether this observation is true (and not a biased observation). To do this, I need to define one or
more variables that I would like to measure. Example: many Big Brother contestants have unpleasant
personalities, they seem to have narcissistic personality disorder.
Generating theories and testing them
The next thing to do is explain these data. One explanation could be that people with narcissistic
personality disorder are more likely to audition for Big Brother than those with out. Another
possibility is that the producers of BB are more likely to select people who have NPD to be contestants
than those without. These are two theories. We verified our original observation by collecting data,
and we can collect more data to test theories. We can make two predictions from the theories, known
as hypotheses.
The first is that the number of people auditioning with NPD will be higher than the general level in the
population. We could test this by getting a team of psychologists to interview each person at the BB
audition and diagnose them as having NPD or not. A prediction from the second theory is that if the
BB selection panel are more likely to choose people with NPD then the rate in the group of people
going for auditions. These data are in Table 1.1.