Marketing Research Methods
As we want to answer Marketing Management questions we need to gather data to be able
to answer our question within an business environment based on reliable data.
How can data be collected?
- Data can be based in the population (describing the whole cake), or can be based on
sampling (describing an fraction of the cake) which is often more time & cost
efficient.
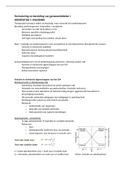
How is data measured?/Measurement level?
- What scale is the variable measured?
o Nominal (Name)
= Green, Yellow, Red
o Ordinal (Order in it): There is no equal distance between the categories
= Not at all-A lot, Age categories 18-20, 20-22….
o Interval: (There is an natural distance between the categories)
= Year of build, Temperature
o Ratio (Natural zero point)
=Age
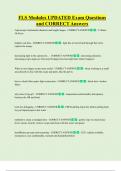
Example:
As result= Depending on the measurement level you are limited to certain types of analysis
(Not every measurement level can be applied to every analysis type)
, Conducting Data Analysis
1st Step before doing data analysis = Inspection and preparation!
This means= Looking for oddities, Missing/wrong values, Outliers
Odd values vs. Outliers
Odd values: Are values which are not possible given the scale of the variable. Odd values will
distort the result of the analysis making it inaccurate.
Outliers: Are values which are possible but are so far from the rest of the other values that
they have a large impact on the variance and mean of the other variables and thus large
impact on the result.
Missing values: Listwise deletion: (Deleting all information of the participant)
A LOT OF INFORMATION IS LOST!
Mostly used when an lot of information is missing
Pairwise deletion: Only the question where data is missing is deleted
Another option is to imputing the data (calculating an mean)
Factor vs. Reliability Analysis
Factor Analysis: Reducing a large quantity of data by finding common variance to:
- retrieve underlying dimensions in your dataset or
- identify latent factors that explain the observed correlations among variables."
German Translation: Reduzierung einer großen Datenmenge durch die Suche nach
gemeinsamer Varianz, um zugrundeliegende Dimensionen in Ihrem Datensatz zu finden oder
latente Faktoren zu identifizieren, die die beobachteten Korrelationen zwischen den
Variablen erklären".
Bei der Faktorenanalyse besteht das Ziel darin, latente (verborgene) Faktoren zu ermitteln,
die die Muster der beobachteten Korrelationen zwischen den Variablen erklären. Durch die
Suche nach gemeinsamer Varianz hilft die Faktorenanalyse, die zugrunde liegenden
Dimensionen oder Faktoren aufzudecken, die zu den beobachteten Daten beitragen. Diese
Verringerung der Datenkomplexität ermöglicht eine vereinfachte Darstellung der
Beziehungen zwischen den Variablen, wodurch die Struktur der Daten leichter zu verstehen
ist.
Common Variance=Correlation between items/Items measuring the same construct
,Why should we combine items together?/Reduce the number of variables?
= -It is the same underlying phenomenon
-It reduces multicollinearity
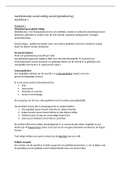
First check if items can be combined= Correlation Matrix
What is standardization?
= Different scales have to be standardized because the impact and range is different
Factor analysis steps:
1. Assumption check: KMO and Bartlett’s test of sphericity
2. Communalities
3. Check correlation matrix
4. FA output: eigenvalue, % of variance, cumulative % of variance
5. Scree Plot
6. Rotating the factor matrix: communalities check
7. subsequent use of factors
Steps for using Factor analysis
Is FA appropriate?
= The KMO (Kaiser Meyer Olkin): checks the partial correlation versus the observed
correlation coefficient/
>The cutoff point where FA is not appropriate anymore= >0.5
= Bartletts Test of Sphericity: tests whether the observed correlation matrix is
significantly different from the identity matrix.
>The cutoff point= <0.05
This makes sense, as you want correlation between the items to be high as you want
to combine items in underlying dimensions based on their similarity for which
correlation is a metric.
Communalities? Explains the amount of variance a variable shares with all the other
variables being considered in factor analysis.
>The threshold is= >0.4
OR the proportion of variance IN A VARIABLE explained by the COMMON factors
>Important to mention that it is that this is a metric OF A VARIABLE and not of a
factor. And that it is the variance shared with the variables / explained by factors
(plural, and not the other way around)
, In summary,= communalities provide insight into how much of a variable's variance is shared
with other variables and is collectively explained by the identified common factors in a factor
analysis. It is a variable-specific measure, emphasizing the collaborative influence of multiple
factors on that particular variable.
The value of communalities for a specific variable is always less than 1. This is because, in
factor analysis, the number of factors is typically fewer than the number of variables being
analyzed. Communalities represent the proportion of a variable's variance explained by the
common factors. Since there are fewer factors than variables, each factor contributes only a
portion of the overall variance in any given variable.
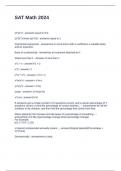
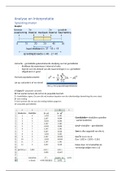
Exam question: What should we do here?
Exam question
Given the outcomes of the KMO measure and the Bartell’s test of sphericity, would you
advice to continue with the factor analysis? Motivate your answer, by explaining for ONE of
the two measures (1point) what this measure actually measures, and (2points) why that is
relevant to measure given the purpose of factor analysis (4points).
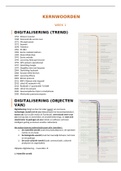
FA output
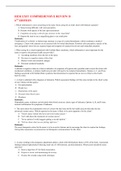
How many factors?
The cutoff point for n amount of factors depends on several indicators:
- Eigenvalue= The Eigenvalue shows how much variance of the variables is explained
by any given factor
As we want to answer Marketing Management questions we need to gather data to be able
to answer our question within an business environment based on reliable data.
How can data be collected?
- Data can be based in the population (describing the whole cake), or can be based on
sampling (describing an fraction of the cake) which is often more time & cost
efficient.
How is data measured?/Measurement level?
- What scale is the variable measured?
o Nominal (Name)
= Green, Yellow, Red
o Ordinal (Order in it): There is no equal distance between the categories
= Not at all-A lot, Age categories 18-20, 20-22….
o Interval: (There is an natural distance between the categories)
= Year of build, Temperature
o Ratio (Natural zero point)
=Age
Example:
As result= Depending on the measurement level you are limited to certain types of analysis
(Not every measurement level can be applied to every analysis type)
, Conducting Data Analysis
1st Step before doing data analysis = Inspection and preparation!
This means= Looking for oddities, Missing/wrong values, Outliers
Odd values vs. Outliers
Odd values: Are values which are not possible given the scale of the variable. Odd values will
distort the result of the analysis making it inaccurate.
Outliers: Are values which are possible but are so far from the rest of the other values that
they have a large impact on the variance and mean of the other variables and thus large
impact on the result.
Missing values: Listwise deletion: (Deleting all information of the participant)
A LOT OF INFORMATION IS LOST!
Mostly used when an lot of information is missing
Pairwise deletion: Only the question where data is missing is deleted
Another option is to imputing the data (calculating an mean)
Factor vs. Reliability Analysis
Factor Analysis: Reducing a large quantity of data by finding common variance to:
- retrieve underlying dimensions in your dataset or
- identify latent factors that explain the observed correlations among variables."
German Translation: Reduzierung einer großen Datenmenge durch die Suche nach
gemeinsamer Varianz, um zugrundeliegende Dimensionen in Ihrem Datensatz zu finden oder
latente Faktoren zu identifizieren, die die beobachteten Korrelationen zwischen den
Variablen erklären".
Bei der Faktorenanalyse besteht das Ziel darin, latente (verborgene) Faktoren zu ermitteln,
die die Muster der beobachteten Korrelationen zwischen den Variablen erklären. Durch die
Suche nach gemeinsamer Varianz hilft die Faktorenanalyse, die zugrunde liegenden
Dimensionen oder Faktoren aufzudecken, die zu den beobachteten Daten beitragen. Diese
Verringerung der Datenkomplexität ermöglicht eine vereinfachte Darstellung der
Beziehungen zwischen den Variablen, wodurch die Struktur der Daten leichter zu verstehen
ist.
Common Variance=Correlation between items/Items measuring the same construct
,Why should we combine items together?/Reduce the number of variables?
= -It is the same underlying phenomenon
-It reduces multicollinearity
First check if items can be combined= Correlation Matrix
What is standardization?
= Different scales have to be standardized because the impact and range is different
Factor analysis steps:
1. Assumption check: KMO and Bartlett’s test of sphericity
2. Communalities
3. Check correlation matrix
4. FA output: eigenvalue, % of variance, cumulative % of variance
5. Scree Plot
6. Rotating the factor matrix: communalities check
7. subsequent use of factors
Steps for using Factor analysis
Is FA appropriate?
= The KMO (Kaiser Meyer Olkin): checks the partial correlation versus the observed
correlation coefficient/
>The cutoff point where FA is not appropriate anymore= >0.5
= Bartletts Test of Sphericity: tests whether the observed correlation matrix is
significantly different from the identity matrix.
>The cutoff point= <0.05
This makes sense, as you want correlation between the items to be high as you want
to combine items in underlying dimensions based on their similarity for which
correlation is a metric.
Communalities? Explains the amount of variance a variable shares with all the other
variables being considered in factor analysis.
>The threshold is= >0.4
OR the proportion of variance IN A VARIABLE explained by the COMMON factors
>Important to mention that it is that this is a metric OF A VARIABLE and not of a
factor. And that it is the variance shared with the variables / explained by factors
(plural, and not the other way around)
, In summary,= communalities provide insight into how much of a variable's variance is shared
with other variables and is collectively explained by the identified common factors in a factor
analysis. It is a variable-specific measure, emphasizing the collaborative influence of multiple
factors on that particular variable.
The value of communalities for a specific variable is always less than 1. This is because, in
factor analysis, the number of factors is typically fewer than the number of variables being
analyzed. Communalities represent the proportion of a variable's variance explained by the
common factors. Since there are fewer factors than variables, each factor contributes only a
portion of the overall variance in any given variable.
Exam question: What should we do here?
Exam question
Given the outcomes of the KMO measure and the Bartell’s test of sphericity, would you
advice to continue with the factor analysis? Motivate your answer, by explaining for ONE of
the two measures (1point) what this measure actually measures, and (2points) why that is
relevant to measure given the purpose of factor analysis (4points).
FA output
How many factors?
The cutoff point for n amount of factors depends on several indicators:
- Eigenvalue= The Eigenvalue shows how much variance of the variables is explained
by any given factor