SPSS & R Cheat Sheet
Psychometrics - Year 2, Block 1
Scaling & Norming Test Scores
Computing a mean/sum variable (for all items on a test): TRANSFORM > COMPUTE VARIABLE > type in the formula for
mean/sum: MEAN.n (item 1 TO item 10) or SUM.n (item 1 TO item 10)
.n = minimum number of items people must answer to be included
Request mean, standard deviation etc.: ANALYZE > DESCRIPTIVE STATISTICS > DESCRIPTIVES > request mean/standard
deviation/etc.
Compute Z-scores: ANALYZE > DESCRIPTIVE STATISTICS > DESCRIPTIVES > add all variables > tick “Save standardized
values as variables”
Compute T-score: TRANSFORM > COMPUTE VARIABLE > type formula for T-score: (Z-score*10)+50
Compute Percentile Rank: TRANSFORM > RANK CASES > add variables
RANK TYPES… > untick “Rank” > tick “Fractional rank as %”
TIES… > select “High”
Create norm table: ANALYZE > REPORTS > CASE SUMMARIES
Add scale (raw) score in “Grouping Variables”
Add norm scores (Z, T, %) in “Variables”
Uncheck “Display cases”
Statistics… > uncheck “Number of cases” > add “Mean” to “Cell statistics”
Reliability
Split-half method
1. Order items based on mean (low-> high): ANALYZE > DESCRIPTIVE STATISTICS > DESCRIPTIVES >
drag items > OPTIONS… > click “Ascending means”
2. Decide which items go in which split
3. Compute Split-Half Reliability: ANALYZE > SCALE > RELIABILITY > add items in “ITEMS” box (in the
previously chosen order)
MODEL > select “Split-Half” (SPSS will split it itself at the middle)
STATISTICS > “DESCRIPTIVES FOR…” > tick “Scale”
- for the value of Split-Half Reliability in output: we look at “Spearman-Brown coefficient” (equal: if we have 2 equal
halves; unequal: if we have unequal halves)
Cronbach’s Alpha: ANALYZE > SCALE > RELIABILITY > Add items in “ITEMS” box (no order needed)
MODEL > select “Alpha”
STATISTICS… > “DESCRIPTIVES FOR…” > tick only “Scale if item deleted”
- items that contribute to reliability: when deleted, Alpha becomes LOWER than original
- items that impair reliability: when deleted, Alpha becomes HIGHER than original
Check if item really impairs reliability: ANALYZE > SCALE > RELIABILITY > remove item that impairs > re-establish
reliability (check if new Alpha matches previous “Alpha if item deleted”)
, Validity
MTMM Matrix
1. Calculate Total Scores: TRANSFORM > COMPUTE VARIABLE > use function SUM (item1 TO item2)
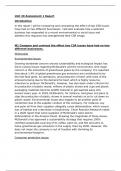
(e.g. if you have 3 traits to measure – learning potential, IQ, personality – and 2 instruments to measure each – multiple choice &
observations => you have 3 x 2 = 6 total scores to compute)
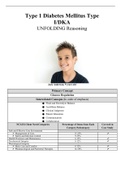
MC OBS
LP IQ PS LP IQ PS
2. Determine the correlations between each of the measures above: ANALYZE > CORRELATE > BIVARIATE > add
total scores in order (e.g. LPMC, IQMC, PSMC, LPOBS, IQOBS, PSOBS - as seen above)
To make only correlations appear in the table: (in Output) DOUBLE CLICK > PIVOT > PIVOTING TRAYS >
drag “Statistics” into “Layer” table
! The resulting table only shows monotrait-heteromethod, heterotrait-monomethod and heterotrait-
heteromethod correlations!
3. Find out the reliability of each measure => monomethod-monotrait correlations (the diagonal of MTMM):
ANALYZE > SCALE > RELIABILITY > drag into “ITEMS” all single items for first trait/instrument measure (not the
previously calculated Total Score, but all single sub-items!) -> repeat for all measures
- resulting Cronbach’s Alpha is = Rxx / monotrait-monomethod correlation
PCA
Preliminary check for PCA (quickly creating Histograms): ANALYZE > DESCRIPTIVES > FREQUENCIES > add all variables
untick “Display frequency tables”
CHARTS… > tick “Histograms” & “Show normal curve”
- inspection: for PCA we need n≥ 300
PCA: ANALYZE > DIMENSION REDUCTION > FACTOR > add all variables
DESCRIPTIVES… > tick “KMO & Bartlett’s test of sphericity” (check KMO >.70, Bartlett - sig.)
EXTRACTION…
(every time) tick “Scree plot”
(if you know how many components you want) tick “Fixed number of factors”
ROTATION…
(every time) tick “Loading Plot”
(when you want a rotation) tick “Varimax rotation”
Psychometrics - Year 2, Block 1
Scaling & Norming Test Scores
Computing a mean/sum variable (for all items on a test): TRANSFORM > COMPUTE VARIABLE > type in the formula for
mean/sum: MEAN.n (item 1 TO item 10) or SUM.n (item 1 TO item 10)
.n = minimum number of items people must answer to be included
Request mean, standard deviation etc.: ANALYZE > DESCRIPTIVE STATISTICS > DESCRIPTIVES > request mean/standard
deviation/etc.
Compute Z-scores: ANALYZE > DESCRIPTIVE STATISTICS > DESCRIPTIVES > add all variables > tick “Save standardized
values as variables”
Compute T-score: TRANSFORM > COMPUTE VARIABLE > type formula for T-score: (Z-score*10)+50
Compute Percentile Rank: TRANSFORM > RANK CASES > add variables
RANK TYPES… > untick “Rank” > tick “Fractional rank as %”
TIES… > select “High”
Create norm table: ANALYZE > REPORTS > CASE SUMMARIES
Add scale (raw) score in “Grouping Variables”
Add norm scores (Z, T, %) in “Variables”
Uncheck “Display cases”
Statistics… > uncheck “Number of cases” > add “Mean” to “Cell statistics”
Reliability
Split-half method
1. Order items based on mean (low-> high): ANALYZE > DESCRIPTIVE STATISTICS > DESCRIPTIVES >
drag items > OPTIONS… > click “Ascending means”
2. Decide which items go in which split
3. Compute Split-Half Reliability: ANALYZE > SCALE > RELIABILITY > add items in “ITEMS” box (in the
previously chosen order)
MODEL > select “Split-Half” (SPSS will split it itself at the middle)
STATISTICS > “DESCRIPTIVES FOR…” > tick “Scale”
- for the value of Split-Half Reliability in output: we look at “Spearman-Brown coefficient” (equal: if we have 2 equal
halves; unequal: if we have unequal halves)
Cronbach’s Alpha: ANALYZE > SCALE > RELIABILITY > Add items in “ITEMS” box (no order needed)
MODEL > select “Alpha”
STATISTICS… > “DESCRIPTIVES FOR…” > tick only “Scale if item deleted”
- items that contribute to reliability: when deleted, Alpha becomes LOWER than original
- items that impair reliability: when deleted, Alpha becomes HIGHER than original
Check if item really impairs reliability: ANALYZE > SCALE > RELIABILITY > remove item that impairs > re-establish
reliability (check if new Alpha matches previous “Alpha if item deleted”)
, Validity
MTMM Matrix
1. Calculate Total Scores: TRANSFORM > COMPUTE VARIABLE > use function SUM (item1 TO item2)
(e.g. if you have 3 traits to measure – learning potential, IQ, personality – and 2 instruments to measure each – multiple choice &
observations => you have 3 x 2 = 6 total scores to compute)
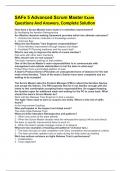
MC OBS
LP IQ PS LP IQ PS
2. Determine the correlations between each of the measures above: ANALYZE > CORRELATE > BIVARIATE > add
total scores in order (e.g. LPMC, IQMC, PSMC, LPOBS, IQOBS, PSOBS - as seen above)
To make only correlations appear in the table: (in Output) DOUBLE CLICK > PIVOT > PIVOTING TRAYS >
drag “Statistics” into “Layer” table
! The resulting table only shows monotrait-heteromethod, heterotrait-monomethod and heterotrait-
heteromethod correlations!
3. Find out the reliability of each measure => monomethod-monotrait correlations (the diagonal of MTMM):
ANALYZE > SCALE > RELIABILITY > drag into “ITEMS” all single items for first trait/instrument measure (not the
previously calculated Total Score, but all single sub-items!) -> repeat for all measures
- resulting Cronbach’s Alpha is = Rxx / monotrait-monomethod correlation
PCA
Preliminary check for PCA (quickly creating Histograms): ANALYZE > DESCRIPTIVES > FREQUENCIES > add all variables
untick “Display frequency tables”
CHARTS… > tick “Histograms” & “Show normal curve”
- inspection: for PCA we need n≥ 300
PCA: ANALYZE > DIMENSION REDUCTION > FACTOR > add all variables
DESCRIPTIVES… > tick “KMO & Bartlett’s test of sphericity” (check KMO >.70, Bartlett - sig.)
EXTRACTION…
(every time) tick “Scree plot”
(if you know how many components you want) tick “Fixed number of factors”
ROTATION…
(every time) tick “Loading Plot”
(when you want a rotation) tick “Varimax rotation”