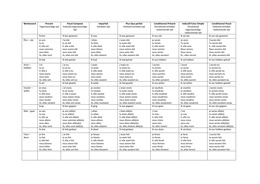
Examples:
Nominal = a gender (1= man or 2= woman)
Ordinal = star rating (1 is better than 2, etc…)
Interval = temperature (difference between 11 and 12 is same as between 12 and 13)
Ratio = amount of money spend (absolute 0)
Mode = value that appears most frequently in a data set
Mean = the average of a data set
Median = the middle value in a data set
Standard Deviation
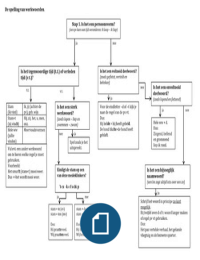
4 steps of hypothesis testing
Step 1 = Formulate the hypothesis H0 = no difference (t-test) or relationship (chi square and
correlation)
Step 2 = Find a statistical value to use (chi-square, or correlation)
Step 3 = Sampling distribution, check how the value from step 2 fits in the sampling distribution
Step 4 = Based on step 3 reject or keep the H0. Check if sample data matches sampling distribution
If the value is in critical area or if the significance is below 5% (.05), we reject the H0. If it is not in
the critical area and the significance is above 5% we accept the H0.
How likely is it that …?
o Standard Score (Z) = (score-mean) / st.dev
o The table of normal distribution
T-test (group differences) – interval & ratio (numerical)
Sig.
o Below 5% (lower line) /// Above 5% (upper line)
Sig. (2-tailed)
o 5% Border (accept or reject H0)
(t(80,72)= 1,50; p=.14
df t sig
There is a significant difference between business and leisure (t(118)= 2.475; p=.015)
Nominal = a gender (1= man or 2= woman)
Ordinal = star rating (1 is better than 2, etc…)
Interval = temperature (difference between 11 and 12 is same as between 12 and 13)
Ratio = amount of money spend (absolute 0)
Mode = value that appears most frequently in a data set
Mean = the average of a data set
Median = the middle value in a data set
Standard Deviation
4 steps of hypothesis testing
Step 1 = Formulate the hypothesis H0 = no difference (t-test) or relationship (chi square and
correlation)
Step 2 = Find a statistical value to use (chi-square, or correlation)
Step 3 = Sampling distribution, check how the value from step 2 fits in the sampling distribution
Step 4 = Based on step 3 reject or keep the H0. Check if sample data matches sampling distribution
If the value is in critical area or if the significance is below 5% (.05), we reject the H0. If it is not in
the critical area and the significance is above 5% we accept the H0.
How likely is it that …?
o Standard Score (Z) = (score-mean) / st.dev
o The table of normal distribution
T-test (group differences) – interval & ratio (numerical)
Sig.
o Below 5% (lower line) /// Above 5% (upper line)
Sig. (2-tailed)
o 5% Border (accept or reject H0)
(t(80,72)= 1,50; p=.14
df t sig
There is a significant difference between business and leisure (t(118)= 2.475; p=.015)