Research Training I
TABLE OF CONTENTS
Module 1: Elements of Statistical Research .................................................................. 3
1.1 Examples of Statistical Research ............................................................................... 3
1.1.1 Presentation of Statistical Research............................................................................................................ 3
1.1.2 School Example .............................................................................................................................................. 4
1.2 Choosing the Appropriate Statistical Methods and Techniques ............................ 6
1.2.1 Measurement Levels of Variables ................................................................................................................ 6
1.2.2 Complexity of Analyses ............................................................................................................................. 10
1.3 Business and Empirical Research ............................................................................ 11
1.4 Models ........................................................................................................................ 12
1.4.1 Causal Relationship Scheme ...................................................................................................................... 12
1.4.2 Formulating Research Hypotheses .......................................................................................................... 14
1.4.3 Causal Patterns ............................................................................................................................................ 15
1.4.4 Roles of Models in Research ..................................................................................................................... 17
Module 2: Population and Sample, Descriptive Analysis and Statistical Estimation . 19
2.1 Sample and Population............................................................................................. 20
2.1.1 Concepts....................................................................................................................................................... 20
2.1.2 Sampling Errors ........................................................................................................................................... 21
2.2 Descriptive Analysis .................................................................................................. 22
2.2.1 Quantitative Data ........................................................................................................................................ 22
2.2.2 Qualitative Data .......................................................................................................................................... 24
2.2.3 Reporting: Figures and Tables................................................................................................................... 25
2.3 Inferential Analysis: Basic Concepts ....................................................................... 26
2.3.1 Properties of Sample Statistics ................................................................................................................. 27
2.3.2 Summary of Sampling Distributions ......................................................................................................... 32
2.4 Inferential Analysis: Estimation ............................................................................... 32
2.4.1 Concept and Estimation Problem ............................................................................................................ 33
2.4.2 Background Interval Estimation and Summary ...................................................................................... 34
2.4.3 Applications: Mean, Variance and Proportion ....................................................................................... 36
2.5 Particularities of Statistical Estimation .................................................................. 38
2.5.1 Interpretation of Interval Estimators ....................................................................................................... 39
2.5.2 Accuracy of Interval Estimators ............................................................................................................... 40
2.5.3 Determine Minimum Required Sample Size........................................................................................... 41
Module 3: Hypothesis Testing ..................................................................................... 42
3.1 Univariate Testing: Idea ........................................................................................... 43
3.2 Testing: 7-Steps Scheme (Neyman-Pearson Procedure) ..................................... 46
1
, 3.3 Overview Test Statistics and Example Test Variance .......................................... 49
3.4 Peculiarities of Hypothesis Testing ......................................................................... 51
3.4.1 Reporting ...................................................................................................................................................... 51
3.4.2 Choice of Significance Level α .................................................................................................................. 52
3.4.3 One-Sided and Two-Sided Testing .......................................................................................................... 53
3.4.4 Fisher’s p-value Approach to Testing ...................................................................................................... 53
3.4.5 Type II Errors and Power of a Test ......................................................................................................... 56
3.4.6 Minimum Required Sample Size ............................................................................................................... 58
3.4.7 Significance and Relevance......................................................................................................................... 60
3.5 Outlook ...................................................................................................................... 61
Module 4: Analysis of Pairwise Associations................................................................ 62
4.1 Analysis of Dependencies ......................................................................................... 62
4.1.1 Overview Methods and Techniques ................................................................................................................ 63
4.1.3 Techniques for Independent and Dependent Samples................................................................................. 65
4.1.4 Analysis Method and Points of Attention ....................................................................................................... 65
4.2 Core Concept: Statistical Independence ................................................................ 66
4.2.1 Causality and Statistical Dependence ...................................................................................................... 66
4.2.2 Definition of Statistical Dependence ....................................................................................................... 67
2
, Module 1: Elements of Statistical Research
1.1 Examples of Statistical Research
• Results of statistical research can be found in all sorts of publications.
• The generation and use of these results are far from straightforward due to: statistical theory, role of
methodology and the interpretation of the outcomes.
(EUR/RSM)
In this course, we will look at the so-called empirical cycle: the process one goes through as a researcher when
doing empirical research. The importance of this course can certainly not be understated because research is
something that we cannot escape from in our day to day lives. Results of research can be found everywhere,
such as in politics, news articles, and scientific journals. To read research outcomes, you will always need a
critical approach because behind the claims there are a large number of choices and interpretational steps that
have been made. In taking such steps one must always be careful, because these are a deciding factor in the
validity of the research. A good grasp of statistical knowledge is thus key in understanding what is said in fields
like politics and science nowadays. This is reflected in this quote from Hal Varian from 2009. “The sexiest job in
the next 10 years will be statisticians.” Long ago, he already saw that a lot of money could be made in this field.
Judging from where he works now, that is certainly the case.
To start, we will introduce some examples of statistical research. First, we will shortly discuss some frequent
mistakes in the presentation of statistical research. And after that, the school example will be introduced, which
will feature in other modules as well.
1.1.1 Presentation of Statistical Research
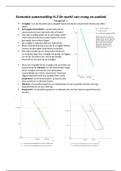
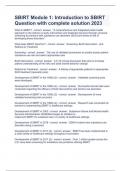
• Title: 'Retail sales go down in April 2000'
• Is this interpretation justified?
• Various aspects of the graphic are wrong, which affects proper interpretation of the presented information.
To open our discussion on the presentation of statistical research, we will discuss an example. This is a graph
taken from an article that headlined “Retail sales go down in April 2000” (= title). If you look at this graph, do
you think this title is fitting? The reason we are showing this example is because many things are wrong with it.
Can you name some of the mistakes? The first thing that
can be criticized is of course the title. If we look at the
graph as a whole, we can see a clear trend upwards, while
the headline is mentioning how there is a decrease in the
last month. Although this could be an informative and
accurate header, in some situations, it is most certainly the
case that decreases from month to month are not very
unique. Moreover, it may not be all that relevant to
compare with the previous month every time. This is a
second point of criticism that can be brought up. Even if
the graph is already seasonally adjusted, it is likely more
useful to compare sales in a given month with sales from
the previous year instead of the previous month. Thirdly,
the way the y-axis is presented can be criticized. As you
can see, this y-axis starts at 225 billion instead of 0. Because
of this, changes in retail sales seem bigger in a graph, than
they actually are. Finally, the labels on the x-axis also seem
incorrectly aligned. If we make a new graph that fixes these
last two problems, the result will look something like this
(next page):
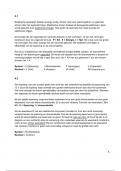
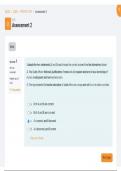
• After adjusting the definition of the y-axis, the message
is much less spectacular (little seems to be going on).
• But in this way, no insight is obtained into monthly
differences.
3
TABLE OF CONTENTS
Module 1: Elements of Statistical Research .................................................................. 3
1.1 Examples of Statistical Research ............................................................................... 3
1.1.1 Presentation of Statistical Research............................................................................................................ 3
1.1.2 School Example .............................................................................................................................................. 4
1.2 Choosing the Appropriate Statistical Methods and Techniques ............................ 6
1.2.1 Measurement Levels of Variables ................................................................................................................ 6
1.2.2 Complexity of Analyses ............................................................................................................................. 10
1.3 Business and Empirical Research ............................................................................ 11
1.4 Models ........................................................................................................................ 12
1.4.1 Causal Relationship Scheme ...................................................................................................................... 12
1.4.2 Formulating Research Hypotheses .......................................................................................................... 14
1.4.3 Causal Patterns ............................................................................................................................................ 15
1.4.4 Roles of Models in Research ..................................................................................................................... 17
Module 2: Population and Sample, Descriptive Analysis and Statistical Estimation . 19
2.1 Sample and Population............................................................................................. 20
2.1.1 Concepts....................................................................................................................................................... 20
2.1.2 Sampling Errors ........................................................................................................................................... 21
2.2 Descriptive Analysis .................................................................................................. 22
2.2.1 Quantitative Data ........................................................................................................................................ 22
2.2.2 Qualitative Data .......................................................................................................................................... 24
2.2.3 Reporting: Figures and Tables................................................................................................................... 25
2.3 Inferential Analysis: Basic Concepts ....................................................................... 26
2.3.1 Properties of Sample Statistics ................................................................................................................. 27
2.3.2 Summary of Sampling Distributions ......................................................................................................... 32
2.4 Inferential Analysis: Estimation ............................................................................... 32
2.4.1 Concept and Estimation Problem ............................................................................................................ 33
2.4.2 Background Interval Estimation and Summary ...................................................................................... 34
2.4.3 Applications: Mean, Variance and Proportion ....................................................................................... 36
2.5 Particularities of Statistical Estimation .................................................................. 38
2.5.1 Interpretation of Interval Estimators ....................................................................................................... 39
2.5.2 Accuracy of Interval Estimators ............................................................................................................... 40
2.5.3 Determine Minimum Required Sample Size........................................................................................... 41
Module 3: Hypothesis Testing ..................................................................................... 42
3.1 Univariate Testing: Idea ........................................................................................... 43
3.2 Testing: 7-Steps Scheme (Neyman-Pearson Procedure) ..................................... 46
1
, 3.3 Overview Test Statistics and Example Test Variance .......................................... 49
3.4 Peculiarities of Hypothesis Testing ......................................................................... 51
3.4.1 Reporting ...................................................................................................................................................... 51
3.4.2 Choice of Significance Level α .................................................................................................................. 52
3.4.3 One-Sided and Two-Sided Testing .......................................................................................................... 53
3.4.4 Fisher’s p-value Approach to Testing ...................................................................................................... 53
3.4.5 Type II Errors and Power of a Test ......................................................................................................... 56
3.4.6 Minimum Required Sample Size ............................................................................................................... 58
3.4.7 Significance and Relevance......................................................................................................................... 60
3.5 Outlook ...................................................................................................................... 61
Module 4: Analysis of Pairwise Associations................................................................ 62
4.1 Analysis of Dependencies ......................................................................................... 62
4.1.1 Overview Methods and Techniques ................................................................................................................ 63
4.1.3 Techniques for Independent and Dependent Samples................................................................................. 65
4.1.4 Analysis Method and Points of Attention ....................................................................................................... 65
4.2 Core Concept: Statistical Independence ................................................................ 66
4.2.1 Causality and Statistical Dependence ...................................................................................................... 66
4.2.2 Definition of Statistical Dependence ....................................................................................................... 67
2
, Module 1: Elements of Statistical Research
1.1 Examples of Statistical Research
• Results of statistical research can be found in all sorts of publications.
• The generation and use of these results are far from straightforward due to: statistical theory, role of
methodology and the interpretation of the outcomes.
(EUR/RSM)
In this course, we will look at the so-called empirical cycle: the process one goes through as a researcher when
doing empirical research. The importance of this course can certainly not be understated because research is
something that we cannot escape from in our day to day lives. Results of research can be found everywhere,
such as in politics, news articles, and scientific journals. To read research outcomes, you will always need a
critical approach because behind the claims there are a large number of choices and interpretational steps that
have been made. In taking such steps one must always be careful, because these are a deciding factor in the
validity of the research. A good grasp of statistical knowledge is thus key in understanding what is said in fields
like politics and science nowadays. This is reflected in this quote from Hal Varian from 2009. “The sexiest job in
the next 10 years will be statisticians.” Long ago, he already saw that a lot of money could be made in this field.
Judging from where he works now, that is certainly the case.
To start, we will introduce some examples of statistical research. First, we will shortly discuss some frequent
mistakes in the presentation of statistical research. And after that, the school example will be introduced, which
will feature in other modules as well.
1.1.1 Presentation of Statistical Research
• Title: 'Retail sales go down in April 2000'
• Is this interpretation justified?
• Various aspects of the graphic are wrong, which affects proper interpretation of the presented information.
To open our discussion on the presentation of statistical research, we will discuss an example. This is a graph
taken from an article that headlined “Retail sales go down in April 2000” (= title). If you look at this graph, do
you think this title is fitting? The reason we are showing this example is because many things are wrong with it.
Can you name some of the mistakes? The first thing that
can be criticized is of course the title. If we look at the
graph as a whole, we can see a clear trend upwards, while
the headline is mentioning how there is a decrease in the
last month. Although this could be an informative and
accurate header, in some situations, it is most certainly the
case that decreases from month to month are not very
unique. Moreover, it may not be all that relevant to
compare with the previous month every time. This is a
second point of criticism that can be brought up. Even if
the graph is already seasonally adjusted, it is likely more
useful to compare sales in a given month with sales from
the previous year instead of the previous month. Thirdly,
the way the y-axis is presented can be criticized. As you
can see, this y-axis starts at 225 billion instead of 0. Because
of this, changes in retail sales seem bigger in a graph, than
they actually are. Finally, the labels on the x-axis also seem
incorrectly aligned. If we make a new graph that fixes these
last two problems, the result will look something like this
(next page):
• After adjusting the definition of the y-axis, the message
is much less spectacular (little seems to be going on).
• But in this way, no insight is obtained into monthly
differences.
3