Introduction to microeconomics
Ten principles of economics
General definition economics= Economics is the science which studies
human behaviour as a relationship between ends and scarce means that
have alternative uses.
Micro: analyse human behaviour from a rational perspective
- people have to make choices, unlimited wants, limited
- how people act
+
Macro : how the economy as a whole works : what, how, for whom will we
produce it?
Macro-economic reality eg. economic growth
M&T principals:
1: people face trade-offs -> you have to make choices
2: the cost of something is what you give up to get it
Implicit cost: eg. if you come to class you can’t study at home / play
soccer, you give the possibility up
<-> explicit cost: money
Coming to class-> miss the best alternative= soccer => implicit cost =
22euro
Explicit + implicit cost = opportunity cost (-> HOC 3)
Final choice (princ. 1) : marginal benefit- explicit cost – implicit cost=
the most benefit
3: rational people think at the margin
-> Alternative with highest value: the thing you prefer the most
4: people respond to incentives
-> Rational actors change their behaviour if costs and/or benefits change
(sufficiently
5: Trade can make everyone better off
6: Markets are usually a good way to organise economic activity
7: Governments can sometimes improve market outcomes
Market forces and supply and demand
market = group of buyers & sellers of a particular good or service perfect
Market structure: number of firms between 0 and infinity
- Monopoly: 1 firm
- Oligopoly: A few firms : homogeneous identically the same
(theoretical! Not reality) / heterogeneous = similar
- Monopolistic competition: many firms : heterogeneous goods
- Perfect competition: many firms: Homogenous goods eg. Market for
wheat
,Market forces assumptions
Perfect competition; Many buyers & many sellers, Perfect information,
Buyers & sellers are price-taker = = nothing to say about the price,
Homogeneous goods, Buyers & sellers act independently, Buyers & sellers
consider all costs & benefits
Monopoly can choose the price themselves -> price takers
Extend in which they can choose the prices: monopoly(100%)> oligopoly>
monopolistic competition> perfect competition(0%)
Real world = in between monopoly and perfect competition
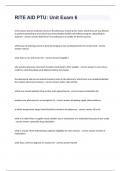
DEMAND
Individual Demand= how much a consumer is willing (and able) to buy at
different prices
Market demand= how much all consumers are willing (and able) to buy at
different prices *
Qd = f ( p ) ó p = f (Qd) (inverse market demand)
Rarity -> more expensive ó more quantity -> cheaper
A = 6 = highest
bidder willing to pay
B= rico
If b = 1-> curve =
steeper ; if b= 1/8th
-> curve= flatter
Higher p
=> income effect :Purchasing power falls because we become poorer
=> substitution effect : Other alternatives become more attractive
Qd falls
!! Law of Demand : Quantity demanded falls as price increases
*Market Demand = Gives the quantity demanded at different prices …
assuming that other factors that affect Demand are constant. -> “Ceteris
paribus” (c.p.)
(Total market demand = sum of every consumers quantities)
(inverse) Market Demand is obtained through horizontal summation of
individual (inverse) Demand curves
,there is only a single price in the market. For each p, q’s may differ among
consumers
+ the amount pp will buy depends on the price but also on other goods,
people’s income
=> Market Demand for n: (qD)n = f (Pn , P1 , P2 , …, Pn-1 , Y, T, PLS, A, E)
Y: income; T: tastes; Pls: level & structure of population; A: advertising; E:
expectations
=>Inverse Market Demand: (qD)n = f (Pn , given [P1, P2, …, Pn-1 , Y, T,
PLS, A, E])
If price changes= movement ALONG the D curve
<-> if other factors change = movement OF the D curve
Right if people become richer; Left if ppl become poorer
Complements= eg. Q sugar decreases if p coffee increases => D shifts to
the left
Substitutes= eg. Q tea increases if p coffee increases
Normal goods= goods for which demand increase if income increases
Inferior goods= if we become richer, we buy less of them eg. spaghetti
bolognese
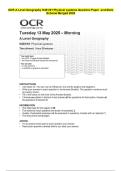
SUPPLY
individual supply= how much a producer is willing to sell at different prices
Market Supply= how much all producers are willing to sell at different
prices*
Qs = f ( p ) ó p = f (Qs ) : inverse (supply) function
(inverse) Market supply is obtained by horizontal summation of the
individual inverse supply curves
If prices go up,
suppliers are willing
to put more on the
market
Law of supply :
Quantity supplied
increases as price
increases
Market Supply* curve Considers the quantity supplied at different prices …
assuming that other factors that affect supply are constant -> Ceteris
paribus
Market supply for n: (Qs)n = f (Pn, P1, ..,Pn-1, H, N/S, F1,F2, ..,Fm ,E , Sq )
Pn: profitability of other goods; H: technology; N/S: natural stocks; social
events; F&: Costs factors of production; Sq: Number of suppliers; E:
, expectations
(inverse) market supply curve: (Qs)n = f (Pn , given [P1, ..,Pn-1, H, N/S,
F1,F2, ..,Fm ,E , Sq ]
If price changes= movement ALONG the supply curve
ó if other factors change=movement OF the supply curve
Goods in joint supply : e.g. The p for cows increases -> p for threads
increase
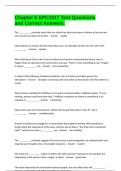
MARKET EQUILIBRIUM
Law of Demand and supply : Price adjusts until quantity demanded and
quantity supplied are equal
At the price of 3 consumers will buy &
producers will produce 12
=> a point is reached that both consumers
and producers “like”
Q* = Qd = Qs
<-> disequilibrium : surplus: equilibrium is disturbed is demand supply
curves move
=> producer has to release price until equilibrium is reached
price signal: how prices allocate resources
= signal for buyers: tells them how much they have to give up to obtain a
good or service
Sellers: tells them what they can obtain if they produce a good or service
->M&T principle1+2+3
Application
drugs are taken from the market by the police->
supply falls
Square: Total Revenue TR = p x q
-> increases
->Because of low price elasticity of demand
Ten principles of economics
General definition economics= Economics is the science which studies
human behaviour as a relationship between ends and scarce means that
have alternative uses.
Micro: analyse human behaviour from a rational perspective
- people have to make choices, unlimited wants, limited
- how people act
+
Macro : how the economy as a whole works : what, how, for whom will we
produce it?
Macro-economic reality eg. economic growth
M&T principals:
1: people face trade-offs -> you have to make choices
2: the cost of something is what you give up to get it
Implicit cost: eg. if you come to class you can’t study at home / play
soccer, you give the possibility up
<-> explicit cost: money
Coming to class-> miss the best alternative= soccer => implicit cost =
22euro
Explicit + implicit cost = opportunity cost (-> HOC 3)
Final choice (princ. 1) : marginal benefit- explicit cost – implicit cost=
the most benefit
3: rational people think at the margin
-> Alternative with highest value: the thing you prefer the most
4: people respond to incentives
-> Rational actors change their behaviour if costs and/or benefits change
(sufficiently
5: Trade can make everyone better off
6: Markets are usually a good way to organise economic activity
7: Governments can sometimes improve market outcomes
Market forces and supply and demand
market = group of buyers & sellers of a particular good or service perfect
Market structure: number of firms between 0 and infinity
- Monopoly: 1 firm
- Oligopoly: A few firms : homogeneous identically the same
(theoretical! Not reality) / heterogeneous = similar
- Monopolistic competition: many firms : heterogeneous goods
- Perfect competition: many firms: Homogenous goods eg. Market for
wheat
,Market forces assumptions
Perfect competition; Many buyers & many sellers, Perfect information,
Buyers & sellers are price-taker = = nothing to say about the price,
Homogeneous goods, Buyers & sellers act independently, Buyers & sellers
consider all costs & benefits
Monopoly can choose the price themselves -> price takers
Extend in which they can choose the prices: monopoly(100%)> oligopoly>
monopolistic competition> perfect competition(0%)
Real world = in between monopoly and perfect competition
DEMAND
Individual Demand= how much a consumer is willing (and able) to buy at
different prices
Market demand= how much all consumers are willing (and able) to buy at
different prices *
Qd = f ( p ) ó p = f (Qd) (inverse market demand)
Rarity -> more expensive ó more quantity -> cheaper
A = 6 = highest
bidder willing to pay
B= rico
If b = 1-> curve =
steeper ; if b= 1/8th
-> curve= flatter
Higher p
=> income effect :Purchasing power falls because we become poorer
=> substitution effect : Other alternatives become more attractive
Qd falls
!! Law of Demand : Quantity demanded falls as price increases
*Market Demand = Gives the quantity demanded at different prices …
assuming that other factors that affect Demand are constant. -> “Ceteris
paribus” (c.p.)
(Total market demand = sum of every consumers quantities)
(inverse) Market Demand is obtained through horizontal summation of
individual (inverse) Demand curves
,there is only a single price in the market. For each p, q’s may differ among
consumers
+ the amount pp will buy depends on the price but also on other goods,
people’s income
=> Market Demand for n: (qD)n = f (Pn , P1 , P2 , …, Pn-1 , Y, T, PLS, A, E)
Y: income; T: tastes; Pls: level & structure of population; A: advertising; E:
expectations
=>Inverse Market Demand: (qD)n = f (Pn , given [P1, P2, …, Pn-1 , Y, T,
PLS, A, E])
If price changes= movement ALONG the D curve
<-> if other factors change = movement OF the D curve
Right if people become richer; Left if ppl become poorer
Complements= eg. Q sugar decreases if p coffee increases => D shifts to
the left
Substitutes= eg. Q tea increases if p coffee increases
Normal goods= goods for which demand increase if income increases
Inferior goods= if we become richer, we buy less of them eg. spaghetti
bolognese
SUPPLY
individual supply= how much a producer is willing to sell at different prices
Market Supply= how much all producers are willing to sell at different
prices*
Qs = f ( p ) ó p = f (Qs ) : inverse (supply) function
(inverse) Market supply is obtained by horizontal summation of the
individual inverse supply curves
If prices go up,
suppliers are willing
to put more on the
market
Law of supply :
Quantity supplied
increases as price
increases
Market Supply* curve Considers the quantity supplied at different prices …
assuming that other factors that affect supply are constant -> Ceteris
paribus
Market supply for n: (Qs)n = f (Pn, P1, ..,Pn-1, H, N/S, F1,F2, ..,Fm ,E , Sq )
Pn: profitability of other goods; H: technology; N/S: natural stocks; social
events; F&: Costs factors of production; Sq: Number of suppliers; E:
, expectations
(inverse) market supply curve: (Qs)n = f (Pn , given [P1, ..,Pn-1, H, N/S,
F1,F2, ..,Fm ,E , Sq ]
If price changes= movement ALONG the supply curve
ó if other factors change=movement OF the supply curve
Goods in joint supply : e.g. The p for cows increases -> p for threads
increase
MARKET EQUILIBRIUM
Law of Demand and supply : Price adjusts until quantity demanded and
quantity supplied are equal
At the price of 3 consumers will buy &
producers will produce 12
=> a point is reached that both consumers
and producers “like”
Q* = Qd = Qs
<-> disequilibrium : surplus: equilibrium is disturbed is demand supply
curves move
=> producer has to release price until equilibrium is reached
price signal: how prices allocate resources
= signal for buyers: tells them how much they have to give up to obtain a
good or service
Sellers: tells them what they can obtain if they produce a good or service
->M&T principle1+2+3
Application
drugs are taken from the market by the police->
supply falls
Square: Total Revenue TR = p x q
-> increases
->Because of low price elasticity of demand