Boxplot Guides d'étude, Notes de cours & Résumés
Vous recherchez les meilleurs guides d'étude, notes d'étude et résumés sur Boxplot ? Sur cette page, vous trouverez 315 documents pour vous aider à réviser pour Boxplot.
Les livres populaires 'Boxplot'
All 315 résultats
Trier par
-
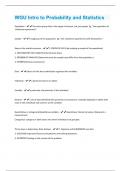
WGU Intro to Probability and Statistics | 107 Questions and Answers(A+ Solution guide)
- Examen • 15 pages • 2023
- €6,14
- 1x vendu
- + en savoir plus
Population - The entire group that is the target of interest, not just people. Eg, "the population of 1 bedroom apartments" Sample - A subgroup of the population. Eg, "the 1 bedroom apartments with dishwashers." Steps in the statistics process - 1. PRODUCE DATA (by studying a sample of the population) 2. EXPLORATORY DATA ANALYSIS (Summarize data.) 3. PROBABILITY ANALYSIS (Determine how the sample may differ from the population.) 4. INFERENCE (draw conclusions) Data - pieces of info about ...
-
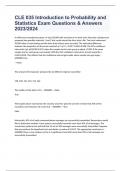
CLE 035 Introduction to Probability and Statistics Exam Questions & Answers 2023/2024
- Examen • 3 pages • 2023
- €8,51
- 1x vendu
- + en savoir plus
CLE 035 Introduction to Probability and Statistics Exam Questions & Answers 2023/2024 A utility truck manufacture gives a 4-year/30,000 mile warranty on its drive train. Recently a design team proposed two possible materials 1 and 2 that could extend the drive train's life. The truck underwent 30,000 miles of road testing and the drive train failures were recorded. The estimated difference between the proportion of drive train materials p^1-p^2 = (0.017-0.009)=0.008. The 95% confidence interv...
-
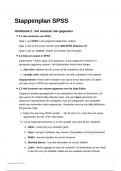
Duidelijk STAPPENPLAN voor Cursus SPSS!
- Resume • 18 pages • 2023
- €3,99
- 27x vendu
- + en savoir plus
In dit stappenplan vind je per onderwerp beschreven welke stappen je moet uitvoeren in SPSS om een bepaalde opdracht uit te voeren. De stappen zijn helder en gedetailleerd omschreven. Met dit stappenplan kan je makkelijk een hoog cijfer halen!
-
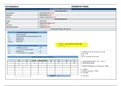
Overzicht EXCEL - holy grail bij het maken van de exceltest - statistiek - 1VAS - HOGENT
- Resume • 6 pages • 2023
- €6,49
- 12x vendu
- + en savoir plus
Ik had een score van 87% op de test van excel mede door dit overzicht. Onder andere staat er hoe je een bosplot moet opbouwen, stap voor stap, bepaalde formules voor het berekenen van gemiddelde, modus etc. (inclusief screenshots van instellingen)
-
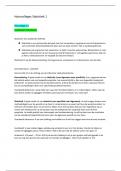
Hoorcolleges Statistiek 1 Pedagogische wetenschappen+
- Notes de cours • 90 pages • 2023 Très apprécié
- €4,99
- 2x vendu
- + en savoir plus
Hier staan de hoorcolleges 1.1 tm 6.2 van het vak statistiek 1 heel uitgebreid beschreven. Dit vak is van de opleiding Vrije Universiteit en werd bij mij gegeven tijdens de Premaster (PMC). Er staan veel voorbeelden in waarin uitgelegd wordt hoe je iets berekend. Het heeft mij ontzettend geholpen.

Et c'est comme ça que vous gagnez de l'argent supplémentaire

-
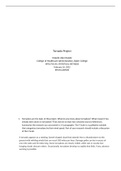
Tornado Project - College of Healthcare Administration, Baker College MTH2750-A4, STATISTICAL METHODS Feb 2022
- Examen • 14 pages • 2023
- €9,45
- 1x vendu
- + en savoir plus
Tornado Project - College of Healthcare Administration, Baker College MTH2750-A4, STATISTICAL METHODS Feb 2022 1. Tornadoes are the topic of this project. What do you know about tornadoes? What resea rch has already been done on tornadoes? Find and cite at least two scholarly sources/references. Summarize the research you uncovered in 3-5 paragraphs. The F Scale is a qualitative variable that categorizes tornadoes by their wind speed. Part of your research should include a discussion of the F Sc...
-
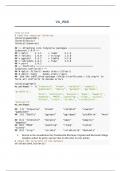
Using_our_Tools_VisualAnalytics_Week8_NEC_Solved
- Examen • 10 pages • 2023
- €9,93
- 1x vendu
- + en savoir plus
1. Return to the visualization for Presidential Elections: Popular and Electoral College margins, subset by party, and use that to add color to your points. 2. Recreate figures 5.28 using functions from the dplyr library. 3. Using gss_sm data, calculate the mean and median number of children by degree 4. Using gapminder data, create a boxplot of life expectancy over time 5. Using gapminder data, create a violin plot of population over time

-
BOXPLOT AND OUTLIER QUESTIONS & ANSWERS 2024 LATEST UPDATE|GUARANTEED SUCCESS
- Examen • 4 pages • 2023
- €12,29
- + en savoir plus
It is necessary to mark the extreme outliers on a box plot. True False True Given the data set 42, 52, 79, 112, 48, 28, 43, 44, 44, 10, 44, what are the mild outlier(s)? 28, 79 79, 112 79 44, 52 79 Brainpower 0:04 / 0:15 What is the Q1, median, and Q3 of a data set with the following values: 42, 52, 79, 112, 48, 28, 43, 44, 44, 10, 44? Q1=42, Median=44, Q3=52 Q1=43, Median=44, Q3=52 Q1=42, Median=44, Q3=48 Q1=43, Median=48, Q3=52 Q1=42, Median=4...
-
Psychologie UU - TOE: Grasple lessen vaardighedentoets Correlationeel en Experimenteel, SPSS en JASP (behaald met een 10)
- Resume • 18 pages • 2023
- €5,99
- 2x vendu
- + en savoir plus
In deze samenvatting vind je alle aantekeningen van de Grasple lessen voor Correlationeel 1 en 2 & Experimenteel 1 en 2, voor de vaardighedentoets van TOE in SPSS en JASP. Ik heb de vaardighedentoets gehaald met een 10.
-
BOXPLOT AND OUTLIER QUESTIONS & ANSWERS 2024 LATEST UPDATE
- Examen • 4 pages • 2023
- €13,71
- + en savoir plus
BOXPLOT AND OUTLIER QUESTIONS & ANSWERS 2024 LATEST UPDATE
