Exercises Answers
Exercise 1
Exercise 1a: Effects of firing rate and recruitment on the EMG signal
First use Ex1_EMG_GUI.m to explore the effects of recruitment and rate coding (firing rate regulation)
on MUAP trains and on the EMG signal and signal amplitude. To do so set sim_mode to 2. The
simulation is done with a random distribution of the firing rate around the specified value, because
having exactly identical and constant firing rate produces very unrealistic signals. Have a close look at
the changes in the EMG and force signals, as well as the changes in the MUAP and twitch trains in
windows 2 and 3.
• Systematically vary the firing rate (FR) within a physiological range (based on lecture slides or
literature), repeat your simulations and average results to obtain the relation of FR with EMG
amplitude and force and with their variability (COV). Prepare plots of these relationships and
explain the differences.
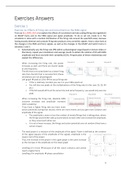
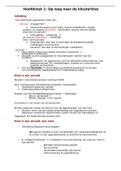
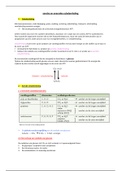
- When increasing the firing rate, the power
increases as well, and there are clearer peaks
at one frequency
- The MU that is recruited later has a lower firing
rate than the MU that is recruited first (these
simulations are not physiological)
- Left graph → peak at 10Hz → the actual firing rate
o If this is relatively constant you see it in your EMG spectrum
o You will also see peaks at the multiplications of the firing rate (in this case 20, 30, 40
etc.)
o If the MU would all fire at the same time and same frequency, you would only see one
peak
- When increasing the firing rate, absolute EMG
outcome increases and amplitude increases
(COV variability)
- If you have a higher firing rate you have more
action potentials during that second, there are more events and you get more variance and
amplitude of the signal.
o The amplitude is more or less the number of events/firings that is taking place, where
the firings would either add up (summation) to each other and increase the amplitude,
or they cancel each other out.
o It is not a linear increase, the firings and action potentials are not random (they have a
certain shape)
- The total power is a measure of the amplitude of the signal. Power is defined as the variance
of the signal (square of the amplitude of the signal), amplitude is the
square root of the power
- Thus, the increase in the power in the upper graph is the same increase
as the increase in the amplitude on the lower graph
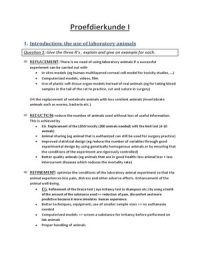
- Levelling of in force → because of all MU reach a tetanus and cannot
reach a higher force
- Levelling of in amplitude → phase cancellation
1
, - Compare magnitude of the variance between amplitude (high) and force (low)
o High COV for amplitude → effect of the very low FR
o Low COV for force → at low FR you do not have the fused tetanus of the MUs, so you
get this variability in the force production, because there is not a smooth force for each
MU
• Systematically vary the number of active MUs within a physiological range (based on lecture
slides), repeat your simulations and average results to obtain the relation of the number of
active MUs with EMG amplitude and force and with their variability (COV). Prepare a plot of
these relationships and explain the differences.
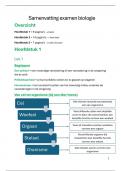
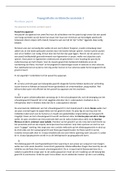
- Increase MU, increase in amplitude (first plot),
because of increase in amount of signal
o Amplitude is the standard deviation, so you
would expect a square root relation
o Increase MU, you get larger MU and thus
larger MU amplitude, so two non-linear
relationships add up to one (sort of) linear
relationship
- Not clear relation between (random variation around 28%)
- Increasing MU size causes the increase in force with increasing MU
number
- More MU the variance goes down for EMG amplitude
• Are effects of FR and the number of active MUs on EMG and force
different? Explain why.
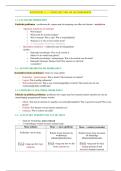
- Plateau in force after higher firing rate
- The later recruited MUs are more of type II fibers and thus have more power, which makes the
shape of the right figure
o You would also expect to see this in the EMG signal, but this is not really the case,
because you also have to take the distance from the MU to the electrode into account
(exercise 2).
o For the force it does not matter where the MU is located in the muscle (deep or
surface), but for the EMG it does matter
o The effect of MU size is much more pronounced in the force than in the EMG amplitude
Exercise 1b: EMG and force
• Set sim_mode to 1 and systematically vary the level of neural drive up to full activation (neural
drive = 1) repeat your simulations and average results to obtain the relation of the neural drive
with EMG amplitude and force and with their variability (COV). Prepare a plot of these
relationships and explain the differences.
2
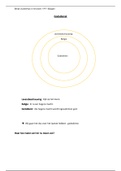
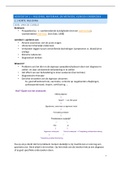
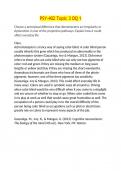
, - Top left →increase in EMG amplitude due to increasing recruitment and
to increasing firing rate
o There is already some EMG when there is no neural drive
(intercept with y-axis) → quite non-linear relationship at the
low forces
- Variability (top right) is slightly decreasing
o If you look at the raw EMG signal at very low activation level,
because of infrequent firing of limited number of MU you can
get times where there is very little activity happening and you
can get larger fluctuations. When there is higher activation level there is more filling
up of the EMG signal and thus less variation
o Large MUs have low firing rate
- Variability in the force is much lower than the variability in the amplitude (right plots) → EMG
is an estimate of force, but a very imprecise one
o Increase in variability is related to large MUs with a low FR
o When all MUs are fully recruited the FR will further increase, and the variability of the
force will decrease again because of the fusion of the tetanus.
- Increase in force is roughly linear
o Exponential increase in the force because of more MU active and levelling of increase
in the force because of increase in firing rate (see previous question)
• Prepare a plot of EMG amplitude versus force. Explain the shape of the curve based on the
results of exercise 1a. Neural drive is often thought of as the total number of action potentials
per unit of time. This is the product of mean FR and the number of active motor units. Also
prepare a plot of this product versus force. Explain the shape of the curve based on results of
1a. Is this product a better predictor of force than the EMG amplitude?
Exercise 2
Exercise 2a: MUAPs, volume conduction and spatial filtering
Ex2_EMG_GUI.m shows in figure 1 the MUAPs of 3 different MUs in a single muscle. The location of
the MUAPs (blue lines) relative to five monopolar electrodes (black symbols) placed at the surface of
a limb (grey cylinder) is shown in the left panel. The blue lines indicate MU location and fiber
direction and length, the red dots indicate the endplate locations and the size of these dots is an
indication of relative MU size. The numbering of the MU represents their recruitment order. The
middle panels show MUAPs recorded with the monopolar electrodes and the right panels show the
spatial derivatives of these monopolar channels. Explore the monopolar MUAPs and identify the
dipole and quadrupole sources in these MUAPs. Note how these features of the MUAP change or
even disappear in the spatial derivatives. To see a different set of MUs, use the <Run Simulation>
button in the GUI (figure 100).
• Compare the ratios of the amplitude of the final positive phase and the amplitude of the
large negative phase between the three MUs. What stands out why? You can use the
graphical representation of location of MUs and the MU properties in the table in figure 2 to
explain these differences.
3
Exercise 1
Exercise 1a: Effects of firing rate and recruitment on the EMG signal
First use Ex1_EMG_GUI.m to explore the effects of recruitment and rate coding (firing rate regulation)
on MUAP trains and on the EMG signal and signal amplitude. To do so set sim_mode to 2. The
simulation is done with a random distribution of the firing rate around the specified value, because
having exactly identical and constant firing rate produces very unrealistic signals. Have a close look at
the changes in the EMG and force signals, as well as the changes in the MUAP and twitch trains in
windows 2 and 3.
• Systematically vary the firing rate (FR) within a physiological range (based on lecture slides or
literature), repeat your simulations and average results to obtain the relation of FR with EMG
amplitude and force and with their variability (COV). Prepare plots of these relationships and
explain the differences.
- When increasing the firing rate, the power
increases as well, and there are clearer peaks
at one frequency
- The MU that is recruited later has a lower firing
rate than the MU that is recruited first (these
simulations are not physiological)
- Left graph → peak at 10Hz → the actual firing rate
o If this is relatively constant you see it in your EMG spectrum
o You will also see peaks at the multiplications of the firing rate (in this case 20, 30, 40
etc.)
o If the MU would all fire at the same time and same frequency, you would only see one
peak
- When increasing the firing rate, absolute EMG
outcome increases and amplitude increases
(COV variability)
- If you have a higher firing rate you have more
action potentials during that second, there are more events and you get more variance and
amplitude of the signal.
o The amplitude is more or less the number of events/firings that is taking place, where
the firings would either add up (summation) to each other and increase the amplitude,
or they cancel each other out.
o It is not a linear increase, the firings and action potentials are not random (they have a
certain shape)
- The total power is a measure of the amplitude of the signal. Power is defined as the variance
of the signal (square of the amplitude of the signal), amplitude is the
square root of the power
- Thus, the increase in the power in the upper graph is the same increase
as the increase in the amplitude on the lower graph
- Levelling of in force → because of all MU reach a tetanus and cannot
reach a higher force
- Levelling of in amplitude → phase cancellation
1
, - Compare magnitude of the variance between amplitude (high) and force (low)
o High COV for amplitude → effect of the very low FR
o Low COV for force → at low FR you do not have the fused tetanus of the MUs, so you
get this variability in the force production, because there is not a smooth force for each
MU
• Systematically vary the number of active MUs within a physiological range (based on lecture
slides), repeat your simulations and average results to obtain the relation of the number of
active MUs with EMG amplitude and force and with their variability (COV). Prepare a plot of
these relationships and explain the differences.
- Increase MU, increase in amplitude (first plot),
because of increase in amount of signal
o Amplitude is the standard deviation, so you
would expect a square root relation
o Increase MU, you get larger MU and thus
larger MU amplitude, so two non-linear
relationships add up to one (sort of) linear
relationship
- Not clear relation between (random variation around 28%)
- Increasing MU size causes the increase in force with increasing MU
number
- More MU the variance goes down for EMG amplitude
• Are effects of FR and the number of active MUs on EMG and force
different? Explain why.
- Plateau in force after higher firing rate
- The later recruited MUs are more of type II fibers and thus have more power, which makes the
shape of the right figure
o You would also expect to see this in the EMG signal, but this is not really the case,
because you also have to take the distance from the MU to the electrode into account
(exercise 2).
o For the force it does not matter where the MU is located in the muscle (deep or
surface), but for the EMG it does matter
o The effect of MU size is much more pronounced in the force than in the EMG amplitude
Exercise 1b: EMG and force
• Set sim_mode to 1 and systematically vary the level of neural drive up to full activation (neural
drive = 1) repeat your simulations and average results to obtain the relation of the neural drive
with EMG amplitude and force and with their variability (COV). Prepare a plot of these
relationships and explain the differences.
2
, - Top left →increase in EMG amplitude due to increasing recruitment and
to increasing firing rate
o There is already some EMG when there is no neural drive
(intercept with y-axis) → quite non-linear relationship at the
low forces
- Variability (top right) is slightly decreasing
o If you look at the raw EMG signal at very low activation level,
because of infrequent firing of limited number of MU you can
get times where there is very little activity happening and you
can get larger fluctuations. When there is higher activation level there is more filling
up of the EMG signal and thus less variation
o Large MUs have low firing rate
- Variability in the force is much lower than the variability in the amplitude (right plots) → EMG
is an estimate of force, but a very imprecise one
o Increase in variability is related to large MUs with a low FR
o When all MUs are fully recruited the FR will further increase, and the variability of the
force will decrease again because of the fusion of the tetanus.
- Increase in force is roughly linear
o Exponential increase in the force because of more MU active and levelling of increase
in the force because of increase in firing rate (see previous question)
• Prepare a plot of EMG amplitude versus force. Explain the shape of the curve based on the
results of exercise 1a. Neural drive is often thought of as the total number of action potentials
per unit of time. This is the product of mean FR and the number of active motor units. Also
prepare a plot of this product versus force. Explain the shape of the curve based on results of
1a. Is this product a better predictor of force than the EMG amplitude?
Exercise 2
Exercise 2a: MUAPs, volume conduction and spatial filtering
Ex2_EMG_GUI.m shows in figure 1 the MUAPs of 3 different MUs in a single muscle. The location of
the MUAPs (blue lines) relative to five monopolar electrodes (black symbols) placed at the surface of
a limb (grey cylinder) is shown in the left panel. The blue lines indicate MU location and fiber
direction and length, the red dots indicate the endplate locations and the size of these dots is an
indication of relative MU size. The numbering of the MU represents their recruitment order. The
middle panels show MUAPs recorded with the monopolar electrodes and the right panels show the
spatial derivatives of these monopolar channels. Explore the monopolar MUAPs and identify the
dipole and quadrupole sources in these MUAPs. Note how these features of the MUAP change or
even disappear in the spatial derivatives. To see a different set of MUs, use the <Run Simulation>
button in the GUI (figure 100).
• Compare the ratios of the amplitude of the final positive phase and the amplitude of the
large negative phase between the three MUs. What stands out why? You can use the
graphical representation of location of MUs and the MU properties in the table in figure 2 to
explain these differences.
3