Mejora tus resultados de búsqueda. Selecciona tu institución educativa y materia para que podamos mostrarte los documentos más relevantes y ayudarte de la mejor manera posible.
Vale, entiendo!
Tu colegio o universidad
Mejora tus resultados de búsqueda. Selecciona tu institución educativa y materia para que podamos mostrarte los documentos más relevantes y ayudarte de la mejor manera posible.
Aquí están los mejores recursos para pasar STATISTICS Math 221. Encuentra STATISTICS Math 221 guías de estudio, notas, tareas, y mucho más.
Página 2 fuera de
22 resultados
Ordenador por
DeVry University, Keller Graduate School of Management_MATH 221Week 2 quiz (Latest 2022/2023)
Examen • 10
páginas
• 2023
Disponible en paquete
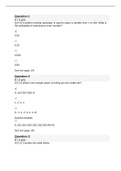
Question 1 2 / 2 pts (CO 2) A random number generator is used to select a number from 1 to 100. What is the probability of selecting an odd number? 0.077 0.050Correct! 0.500 0.250 Question 2 2 / 2 pts (CO 2) What is the sample space of rolling two four-sided die? 1, 2, 3, 4Correct! (1,2)(1,3)(1,4)(2,2)(2,3)(2,4)(3,4)(4,4) (1, 1, 2, 2, 3, 3, 4, 4) (1,1)(2,2)(3,3)(4,4) Question 3 0 / 2 pts (CO 2) Consider the table below Response (number of cats owned) Frequency None 659 One 329 Two 52 Three 13 Fo...
DeVry University, Keller Graduate School of Management_MATH 221Week 2 quiz (Latest 2022/2023)
Última actualización de este documento:
hace
Question 1 2 / 2 pts (CO 2) A random number generator is used to select a number from 1 to 100. What is the probability of selecting an odd number? 0.077 0.050Correct! 0.500 0.250 Question 2 2 / 2 pts (CO 2) What is the sample space of rolling two four-sided die? 1, 2, 3, 4Correct! (1,2)(1,3)(1,4)(2,2)(2,3)(2,4)(3,4)(4,4) (1, 1, 2, 2, 3, 3, 4, 4) (1,1)(2,2)(3,3)(4,4) Question 3 0 / 2 pts (CO 2) Consider the table below Response (number of cats owned) Frequency None 659 One 329 Two 52 Three 13 Fo...
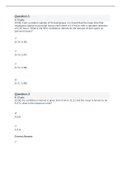
Question 1
2 / 2 pts
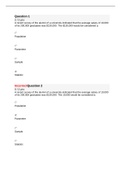
A recent survey of the alumni of a university indicated that the average salary of 10,000
of its 200,000 graduates was $130,000. The $130,000 would be considered a:
Population
Parameter
Sample
Statistic
IncorrectQuestion 2
0 / 2 pts
A recent survey of the alumni of a university indicated that the average salary of 10,000
of its 200,000 graduates was $130,000. The 10,000 would be considered a:
Population
Parameter
Sample
Statistic
Question 3
2 / 2 pts
Based ...
Math 221 Week 1 Quiz Answers 2023
Última actualización de este documento:
hace
Question 1
2 / 2 pts
A recent survey of the alumni of a university indicated that the average salary of 10,000
of its 200,000 graduates was $130,000. The $130,000 would be considered a:
Population
Parameter
Sample
Statistic
IncorrectQuestion 2
0 / 2 pts
A recent survey of the alumni of a university indicated that the average salary of 10,000
of its 200,000 graduates was $130,000. The 10,000 would be considered a:
Population
Parameter
Sample
Statistic
Question 3
2 / 2 pts
Based ...
Math 221 Week 2 Homework Quiz (answered correctly)
Examen • 11
páginas
• 2023
Disponible en paquete
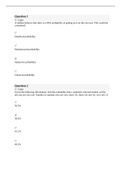
Question 1
2 / 2 pts
A student believes that there is a 90% probability of getting an A on the next test. This would be
considered:
Empirical probability
Manufactured probability
Subjective probability
Classical probability
Question 2
2 / 2 pts
Given the following information, find the probability that a randomly selected student will be
tall, but not very tall. Number of students who are very short: 45, short: 60, tall: 82, very tall: 21
50.5%
39.4%
10.1%
49.5%
IncorrectQuestion...
Math 221 Week 2 Homework Quiz (answered correctly)
Última actualización de este documento:
hace
Question 1
2 / 2 pts
A student believes that there is a 90% probability of getting an A on the next test. This would be
considered:
Empirical probability
Manufactured probability
Subjective probability
Classical probability
Question 2
2 / 2 pts
Given the following information, find the probability that a randomly selected student will be
tall, but not very tall. Number of students who are very short: 45, short: 60, tall: 82, very tall: 21
50.5%
39.4%
10.1%
49.5%
IncorrectQuestion...
DeVry University, Naperville MATH 221 Week 3 HW help questions and answers well elaborated
Examen • 7
páginas
• 2023
Disponible en paquete
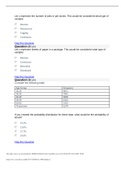
Let x represent the number of pets in pet stores. This would be considered what type of
variable:
Discrete
Nonsensical
Lagging
Continuous
Flag this Question
Question 22 pts
Let x represent sheets of paper in a package. This would be considered what type of
variable:
Discrete
Continuous
Inferential
Distributed
Flag this Question
Question 32 pts
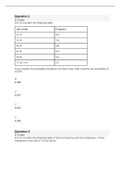
Consider the following table.
Age Group Frequency
18-29 9831
30-39 7845
40-49 6869
50-59 6323
60-69 5410
70 and over 5279
If you c...
DeVry University, Naperville MATH 221 Week 3 HW help questions and answers well elaborated
Última actualización de este documento:
hace
Let x represent the number of pets in pet stores. This would be considered what type of
variable:
Discrete
Nonsensical
Lagging
Continuous
Flag this Question
Question 22 pts
Let x represent sheets of paper in a package. This would be considered what type of
variable:
Discrete
Continuous
Inferential
Distributed
Flag this Question
Question 32 pts
Consider the following table.
Age Group Frequency
18-29 9831
30-39 7845
40-49 6869
50-59 6323
60-69 5410
70 and over 5279
If you c...
¿Cuánto te has gastado ya en Stuvia? Imagina que sois muchos más los que estáis ahí fuera pagando por apuntes de estudio, pero esta vez TÚ eres el vendedor. ¡Ka-ching!
DeVry University, Naperville MATH 221 quiz (Latest 2023)
Examen • 19
páginas
• 2023
Disponible en paquete
Question 1
2 / 2 pts
(CO 4) Consider the following table:
Age Group Frequency
18-29 983
30-39 784
40-49 686
50-59 632
60-69 541
70 and over 527
If you created the probability distribution for these data, what would be the probability of
30-39?
0.189
0.237
0.425
0.165
Question 2
2 / 2 pts
(CO 4) Consider the following table of hours worked by part-time employees. These
employees must work in 5 hour blocks.
Weekly hours worked Probability
5 0.06
15 0.61
20 0.18
25 0.15
Fin...
DeVry University, Naperville MATH 221 quiz (Latest 2023)
Última actualización de este documento:
hace
Question 1
2 / 2 pts
(CO 4) Consider the following table:
Age Group Frequency
18-29 983
30-39 784
40-49 686
50-59 632
60-69 541
70 and over 527
If you created the probability distribution for these data, what would be the probability of
30-39?
0.189
0.237
0.425
0.165
Question 2
2 / 2 pts
(CO 4) Consider the following table of hours worked by part-time employees. These
employees must work in 5 hour blocks.
Weekly hours worked Probability
5 0.06
15 0.61
20 0.18
25 0.15
Fin...
MATH221_W4_Lab_Excel_Adrian Arneson>MATH221 Statistics for Decision Making Week 4 Lab study guide Updated Spring 2023.
Otro • 6
páginas
• 2023
Disponible en paquete
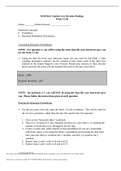
Calculating Binomial Probabilities
NOTE: For question 1, you will be using the same data file your instructor gave you
for the Week 2 Lab.
1. Using the data file from your instructor (same one you used for the Week 2 Lab),
calculate descriptive statistics for the variable (Coin) where each of the thirty-five
students in the sample flipped a coin 10 times. Round your answers to three decimal
places and type the mean and the standard deviation in the grey area below.
Mean: 3.886
Standard d...
MATH221_W4_Lab_Excel_Adrian Arneson>MATH221 Statistics for Decision Making Week 4 Lab study guide Updated Spring 2023.
Última actualización de este documento:
hace
Calculating Binomial Probabilities
NOTE: For question 1, you will be using the same data file your instructor gave you
for the Week 2 Lab.
1. Using the data file from your instructor (same one you used for the Week 2 Lab),
calculate descriptive statistics for the variable (Coin) where each of the thirty-five
students in the sample flipped a coin 10 times. Round your answers to three decimal
places and type the mean and the standard deviation in the grey area below.
Mean: 3.886
Standard d...
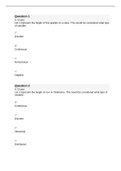
Question 1
2 / 2 pts
Let x represent the height of first graders in a class. This would be considered what type
of variable:
Discrete
Continuous
Nonsensical
Lagging
Question 2
2 / 2 pts
Let x represent the height of corn in Oklahoma. This would be considered what type of
variable:
Continuous
Discrete
Inferential
Distributed
IncorrectQuestion 3
0 / 2 pts
Consider the following table.
Age Group Frequency
18-29 9831
30-39 7845
40-49 6869
50-59 6323
60-69 5410
70 and over 52...
DeVry University, Naperville MATH 221 Week 3 HW Quiz (answered correctly)
Última actualización de este documento:
hace
Question 1
2 / 2 pts
Let x represent the height of first graders in a class. This would be considered what type
of variable:
Discrete
Continuous
Nonsensical
Lagging
Question 2
2 / 2 pts
Let x represent the height of corn in Oklahoma. This would be considered what type of
variable:
Continuous
Discrete
Inferential
Distributed
IncorrectQuestion 3
0 / 2 pts
Consider the following table.
Age Group Frequency
18-29 9831
30-39 7845
40-49 6869
50-59 6323
60-69 5410
70 and over 52...
MATH221 Statistics for Decision Making Week 6 Lab quiz (Latest 2022/2023)
Examen • 4
páginas
• 2023
Disponible en paquete
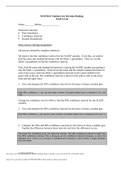
Short Answer Writing Assignment
All answers should be complete sentences.
We need to find the confidence interval for the SLEEP variable. To do this, we need to
find the mean and standard deviation with the Week 1 spreadsheet. Then we can the
Week 5 spreadsheet to find the confidence interval.
First, find the mean and standard deviation by copying the SLEEP variable and pasting it
into the Week 1 spreadsheet. Write down the mean and the sample standard deviation as
well as the count. Open...
MATH221 Statistics for Decision Making Week 6 Lab quiz (Latest 2022/2023)
Última actualización de este documento:
hace
Short Answer Writing Assignment
All answers should be complete sentences.
We need to find the confidence interval for the SLEEP variable. To do this, we need to
find the mean and standard deviation with the Week 1 spreadsheet. Then we can the
Week 5 spreadsheet to find the confidence interval.
First, find the mean and standard deviation by copying the SLEEP variable and pasting it
into the Week 1 spreadsheet. Write down the mean and the sample standard deviation as
well as the count. Open...
DeVry University, Keller Graduate School of Management_MATH 221Week 7 quiz (Latest 2022/2023)
Examen • 18
páginas
• 2023
Disponible en paquete
Question 1
2 / 2 pts
(CO6) From a random sample of 55 businesses, it is found that the mean time that
employees spend on personal issues each week is 5.8 hours with a standard deviation
of 0.35 hours. What is the 95% confidence interval for the amount of time spent on
personal issues?
(5.74, 5.90)
(5.73, 5.87)
(5.72, 5.88)
Correct!
(5.71, 5.89)
Question 2
0 / 2 pts
(CO6) If a confidence interval is given from 8.54 to 10.21 and the mean is known to be
9.375, what is the maximum erro...
DeVry University, Keller Graduate School of Management_MATH 221Week 7 quiz (Latest 2022/2023)
Última actualización de este documento:
hace
Question 1
2 / 2 pts
(CO6) From a random sample of 55 businesses, it is found that the mean time that
employees spend on personal issues each week is 5.8 hours with a standard deviation
of 0.35 hours. What is the 95% confidence interval for the amount of time spent on
personal issues?
(5.74, 5.90)
(5.73, 5.87)
(5.72, 5.88)
Correct!
(5.71, 5.89)
Question 2
0 / 2 pts
(CO6) If a confidence interval is given from 8.54 to 10.21 and the mean is known to be
9.375, what is the maximum erro...
¿Quiere recuperar sus gastos?
¿Cuánto te has gastado ya en Stuvia? Imagina que sois muchos más los que estáis ahí fuera pagando por apuntes de estudio, pero esta vez TÚ eres el vendedor. ¡Ka-ching!
Descubre todo sobre cómo ganar en Stuvia