Mejora tus resultados de búsqueda. Selecciona tu institución educativa y materia para que podamos mostrarte los documentos más relevantes y ayudarte de la mejor manera posible.
Vale, entiendo!
Tu colegio o universidad
Mejora tus resultados de búsqueda. Selecciona tu institución educativa y materia para que podamos mostrarte los documentos más relevantes y ayudarte de la mejor manera posible.
Aquí están los mejores recursos para pasar STATISTICS Math 221. Encuentra STATISTICS Math 221 guías de estudio, notas, tareas, y mucho más.
All
22 resultados
Ordenador por
Math 221 Week 1 Quiz Answers help questions and answers well elaborated
Examen • 12
páginas
• 2023
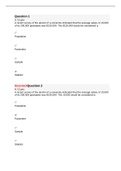
Question 1
2 / 2 pts
A recent survey of the alumni of a university indicated that the average salary of 10,000
of its 200,000 graduates was $130,000. The $130,000 would be considered a:
Population
Parameter
Sample
Statistic
IncorrectQuestion 2
0 / 2 pts
A recent survey of the alumni of a university indicated that the average salary of 10,000
of its 200,000 graduates was $130,000. The 10,000 would be considered a:
Population
Parameter
Sample
Statistic
Question 3
2 / 2 pts
Based ...
Math 221 Week 1 Quiz Answers help questions and answers well elaborated
Última actualización de este documento:
hace
Question 1
2 / 2 pts
A recent survey of the alumni of a university indicated that the average salary of 10,000
of its 200,000 graduates was $130,000. The $130,000 would be considered a:
Population
Parameter
Sample
Statistic
IncorrectQuestion 2
0 / 2 pts
A recent survey of the alumni of a university indicated that the average salary of 10,000
of its 200,000 graduates was $130,000. The 10,000 would be considered a:
Population
Parameter
Sample
Statistic
Question 3
2 / 2 pts
Based ...
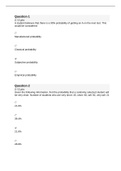
Question 1
2 / 2 pts
A student believes that there is a 90% probability of getting an A on the next test. This
would be considered:
Manufactured probability
Classical probability
Subjective probability
Empirical probability
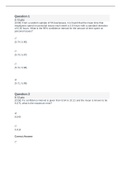
Question 2
2 / 2 pts
Given the following information, find the probability that a randomly selected student will
be very short. Number of students who are very short: 45, short: 60, tall: 82, very tall: 21
21.0%
39.4%
21.6%
28.8%
IncorrectQuestion 3
0 / 2 pts...
Math 221 Week 2 Homework
Última actualización de este documento:
hace
Question 1
2 / 2 pts
A student believes that there is a 90% probability of getting an A on the next test. This
would be considered:
Manufactured probability
Classical probability
Subjective probability
Empirical probability
Question 2
2 / 2 pts
Given the following information, find the probability that a randomly selected student will
be very short. Number of students who are very short: 45, short: 60, tall: 82, very tall: 21
21.0%
39.4%
21.6%
28.8%
IncorrectQuestion 3
0 / 2 pts...
uestion 1
2 / 2 pts
A student believes that there is a 90% probability of getting an A on the next test. This would be
considered:
Empirical probability
Manufactured probability
Subjective probability
Classical probability
Question 2
2 / 2 pts
Given the following information, find the probability that a randomly selected student will be
tall, but not very tall. Number of students who are very short: 45, short: 60, tall: 82, very tall: 21
50.5%
39.4%
10.1%
49.5%
DeVry University, Naperville MATH 221 Week 3 HW Quiz (answered correctly)
Última actualización de este documento:
hace
uestion 1
2 / 2 pts
A student believes that there is a 90% probability of getting an A on the next test. This would be
considered:
Empirical probability
Manufactured probability
Subjective probability
Classical probability
Question 2
2 / 2 pts
Given the following information, find the probability that a randomly selected student will be
tall, but not very tall. Number of students who are very short: 45, short: 60, tall: 82, very tall: 21
50.5%
39.4%
10.1%
49.5%
Math 221 Week 2 Homework Quiz (answered correctly)Spring 2023.
Examen • 11
páginas
• 2023
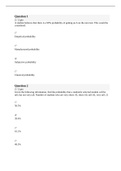
uestion 1
2 / 2 pts
The probability of drawing one card and getting queen is 4/52. This would be considered:
Subjective probability
Empirical probability
Manufactured probability
Classical probability
IncorrectQuestion 2
0 / 2 pts
Given the following information, find the probability that a randomly selected student will be
very tall. Number of students who are very short: 45, short: 60, tall: 82, very tall: 21
21.0%
10.1%
21.6%
49.5%
Question 3
2 / 2 pts
Given the following inf...
Math 221 Week 2 Homework Quiz (answered correctly)Spring 2023.
Última actualización de este documento:
hace
uestion 1
2 / 2 pts
The probability of drawing one card and getting queen is 4/52. This would be considered:
Subjective probability
Empirical probability
Manufactured probability
Classical probability
IncorrectQuestion 2
0 / 2 pts
Given the following information, find the probability that a randomly selected student will be
very tall. Number of students who are very short: 45, short: 60, tall: 82, very tall: 21
21.0%
10.1%
21.6%
49.5%
Question 3
2 / 2 pts
Given the following inf...
MATH221_W4_Lab_Excel_Adrian Arneson>MATH221 Statistics for Decision Making Week 4 Lab study guide Updated Spring 2023.
Examen • 6
páginas
• 2023
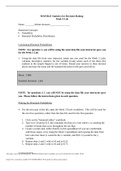
MATH221 Statistics for Decision Making
Week 4 Lab
Name: _______ Adrian Arneson ________________
Statistical Concepts:
Probability
Binomial Probability Distribution
Calculating Binomial Probabilities
NOTE: For question 1, you will be using the same data file your instructor gave you
for the Week 2 Lab.
1. Using the data file from your instructor (same one you used for the Week 2 Lab),
calculate descriptive statistics for the variable (Coin) where each of the thirty-five
student...
MATH221_W4_Lab_Excel_Adrian Arneson>MATH221 Statistics for Decision Making Week 4 Lab study guide Updated Spring 2023.
Última actualización de este documento:
hace
MATH221 Statistics for Decision Making
Week 4 Lab
Name: _______ Adrian Arneson ________________
Statistical Concepts:
Probability
Binomial Probability Distribution
Calculating Binomial Probabilities
NOTE: For question 1, you will be using the same data file your instructor gave you
for the Week 2 Lab.
1. Using the data file from your instructor (same one you used for the Week 2 Lab),
calculate descriptive statistics for the variable (Coin) where each of the thirty-five
student...
Exam (elaborations) MATH 221 Week 5 Homework well explained 2023 latest
Examen • 6
páginas
• 2023
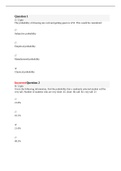
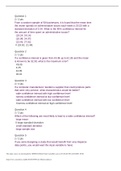
Question 1
2 / 2 pts
From a random sample of 58 businesses, it is found that the mean time
the owner spends on administrative issues each week is 20.53 with a
standard deviation of 3.54. What is the 95% confidence interval for
the amount of time spent on administrative issues?
(19.24, 24.14)
(16.99, 24.07)
(13.45, 27.61)
X (19.62, 21.44)
Question 2
2 / 2 pts
If a confidence interval is given from 43.85 up to 61.95 and the mean
is known to be 52.90, what is the maximum error?
X9...
Exam (elaborations) MATH 221 Week 5 Homework well explained 2023 latest
Última actualización de este documento:
hace
Question 1
2 / 2 pts
From a random sample of 58 businesses, it is found that the mean time
the owner spends on administrative issues each week is 20.53 with a
standard deviation of 3.54. What is the 95% confidence interval for
the amount of time spent on administrative issues?
(19.24, 24.14)
(16.99, 24.07)
(13.45, 27.61)
X (19.62, 21.44)
Question 2
2 / 2 pts
If a confidence interval is given from 43.85 up to 61.95 and the mean
is known to be 52.90, what is the maximum error?
X9...
DeVry University, Naperville MATH 221 Week 3 Quiz (answered correctly
Examen • 18
páginas
• 2023
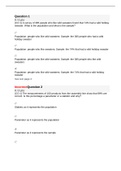
Question 1
0 / 2 pts
(CO 1) A survey of 385 people who like wild sweaters found that 74% had a wild holiday
sweater. What is the population and what is the sample?
Population: people who like wild sweaters: Sample: the 385 people who had a wild
holiday sweater
Population: people who like sweaters; Sample: the 74% that had a wild holiday sweater
Population: people who like wild sweaters; Sample: the 385 people who like wild
sweaters
Population: people who like wild sweaters; Sample: the ...
DeVry University, Naperville MATH 221 Week 3 Quiz (answered correctly
Última actualización de este documento:
hace
Question 1
0 / 2 pts
(CO 1) A survey of 385 people who like wild sweaters found that 74% had a wild holiday
sweater. What is the population and what is the sample?
Population: people who like wild sweaters: Sample: the 385 people who had a wild
holiday sweater
Population: people who like sweaters; Sample: the 74% that had a wild holiday sweater
Population: people who like wild sweaters; Sample: the 385 people who like wild
sweaters
Population: people who like wild sweaters; Sample: the ...
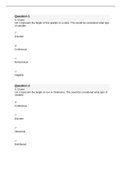
Question 1
2 / 2 pts
Let x represent the height of first graders in a class. This would be considered what type
of variable:
Discrete
Continuous
Nonsensical
Lagging
Question 2
2 / 2 pts
Let x represent the height of corn in Oklahoma. This would be considered what type of
variable:
Continuous
Discrete
Inferential
Distributed
IncorrectQuestion 3
0 / 2 pts
Consider the following table.
Age Group Frequency
18-29 9831
30-39 7845
40-49 6869
50-59 6323
60-69 5410
70 and over 52...
DeVry University, Naperville MATH 221 Week 3 HW Quiz (answered correctly)
Última actualización de este documento:
hace
Question 1
2 / 2 pts
Let x represent the height of first graders in a class. This would be considered what type
of variable:
Discrete
Continuous
Nonsensical
Lagging
Question 2
2 / 2 pts
Let x represent the height of corn in Oklahoma. This would be considered what type of
variable:
Continuous
Discrete
Inferential
Distributed
IncorrectQuestion 3
0 / 2 pts
Consider the following table.
Age Group Frequency
18-29 9831
30-39 7845
40-49 6869
50-59 6323
60-69 5410
70 and over 52...
Exam (elaborations) DeVry University, Naperville MATH 221 quiz 5(Latest 2023)
Examen • 19
páginas
• 2023
Question 1
2 / 2 pts
(CO 4) Consider the following table:
Age Group Frequency
18-29 983
30-39 784
40-49 686
50-59 632
60-69 541
70 and over 527
If you created the probability distribution for these data, what would be the probability of
30-39?
0.189
0.237
0.425
0.165
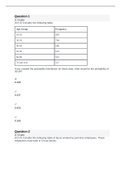
Question 2
2 / 2 pts
(CO 4) Consider the following table of hours worked by part-time employees. These
employees must work in 5 hour blocks.
Weekly hours worked Probability
5 0.06
15 0.61
20 0.18
25 0.15
Fin...
Exam (elaborations) DeVry University, Naperville MATH 221 quiz 5(Latest 2023)
Última actualización de este documento:
hace
Question 1
2 / 2 pts
(CO 4) Consider the following table:
Age Group Frequency
18-29 983
30-39 784
40-49 686
50-59 632
60-69 541
70 and over 527
If you created the probability distribution for these data, what would be the probability of
30-39?
0.189
0.237
0.425
0.165
Question 2
2 / 2 pts
(CO 4) Consider the following table of hours worked by part-time employees. These
employees must work in 5 hour blocks.
Weekly hours worked Probability
5 0.06
15 0.61
20 0.18
25 0.15
Fin...
DeVry University, Naperville MATH 221 Math 221 Week 7 Quiz
Examen • 18
páginas
• 2023
Question 1
2 / 2 pts
(CO6) From a random sample of 55 businesses, it is found that the mean time that
employees spend on personal issues each week is 5.8 hours with a standard deviation
of 0.35 hours. What is the 95% confidence interval for the amount of time spent on
personal issues?
(5.74, 5.90)
(5.73, 5.87)
(5.72, 5.88)
Correct!
(5.71, 5.89)
Question 2
0 / 2 pts
(CO6) If a confidence interval is given from 8.54 to 10.21 and the mean is known to be
9.375, what is the maximum erro...
DeVry University, Naperville MATH 221 Math 221 Week 7 Quiz
Última actualización de este documento:
hace
Question 1
2 / 2 pts
(CO6) From a random sample of 55 businesses, it is found that the mean time that
employees spend on personal issues each week is 5.8 hours with a standard deviation
of 0.35 hours. What is the 95% confidence interval for the amount of time spent on
personal issues?
(5.74, 5.90)
(5.73, 5.87)
(5.72, 5.88)
Correct!
(5.71, 5.89)
Question 2
0 / 2 pts
(CO6) If a confidence interval is given from 8.54 to 10.21 and the mean is known to be
9.375, what is the maximum erro...
Haz menos doloroso el estrés del estudio
¿Estrés por los estudios? Para los vendedores en Stuvia, estos son tiempos de oro. ¡KA-CHING! Gana también con tus resúmenes y empieza a subirlos ya.
Descubre todo sobre cómo ganar en Stuvia